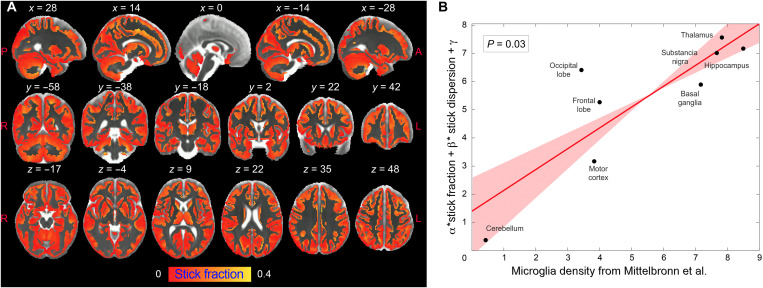
Fig. 6. Correlation between the stick fraction and microglia density in human brain.
(A) Stick fraction according to the MCM normalized to the brain template defined in (56), masked for gray matter tissue, and averaged across subjects. (B) Multiple linear regression using stick fraction and dispersion to explain microglia density measured using histological staining of postmortem human tissue in eight gray matter regions (hippocampus, cerebellum, substantia nigra, basal ganglia, thalamus, motor, frontal, and occipital cortices) as reported in (26). Regression confidence intervals are calculated using bootstrap.

