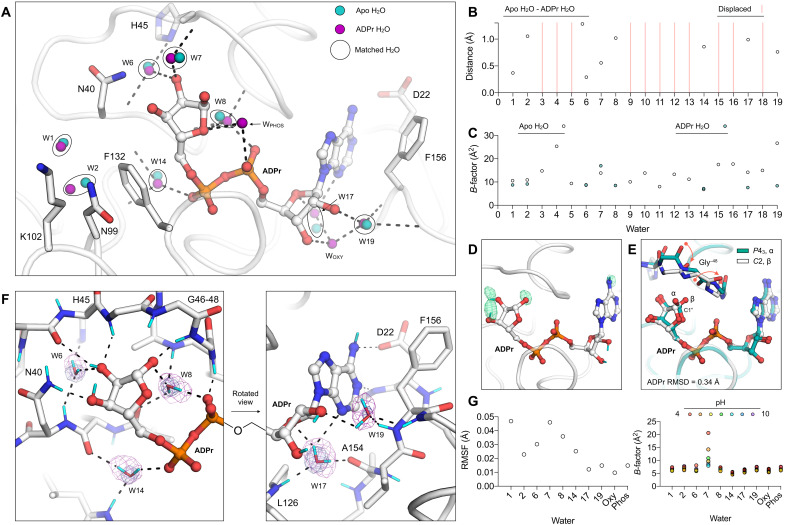
Fig. 6. Reorganization of water networks upon ADPr binding.
(A) Active site water positions from the structure of ADPr-bound Mac1 determined at 100 K (P43 crystal, PDB code 7KQP) compared to the apo structure (PDB code 7KQO). For clarity, only selected side chains of the ADPr-bound structure are shown (white sticks). Hydrogen bonds are shown as dashed black lines. (B) Plot showing distances between the water molecules shown in (A). (C) Plot showing the B-factors for waters shown in (A). (D) Evidence for HDX in ADPr cocrystallized with Mac1 (C2, PDB code 7TX5). The mFO − DFC NSL density map calculated after joint neutron/x-ray refinement but before adding deuterium atoms to ADPr is shown with a green mesh (contoured at +3 σ). No density was observed for the C2′ and C3′ hydroxyl deuteriums. (E) Alignment of the ADPr-bound Mac1 structures determined using P43 and C2 crystals. The two epimers of the terminal ribose are marked (α and β), and the conformational change required to bind the α epimer in the C2 crystal is shown with red arrows. (F) Hydrogen bond networks in the ADPr-bound Mac1 structure determined using neutron diffraction (C2, PDB code 7TX5). The 2mFO − DFC NSL density map is shown for bridging water molecules with a purple mesh (contoured at 2.5 σ for W6, W8, W14, and W17 and at 2 σ for W19). The 2mFO − DFC electron density map is contoured at 2 σ (blue mesh). Deuterium atoms are colored cyan, and hydrogen bonds are shown with dashed black lines. (G) Left: Plot showing the RMSF of active site water molecules calculated across the seven ADPr-bound structures determined from pH 4 to 10. Right: B-factors for water molecules in the ADPr-bound structures from pH 4 to 10.

