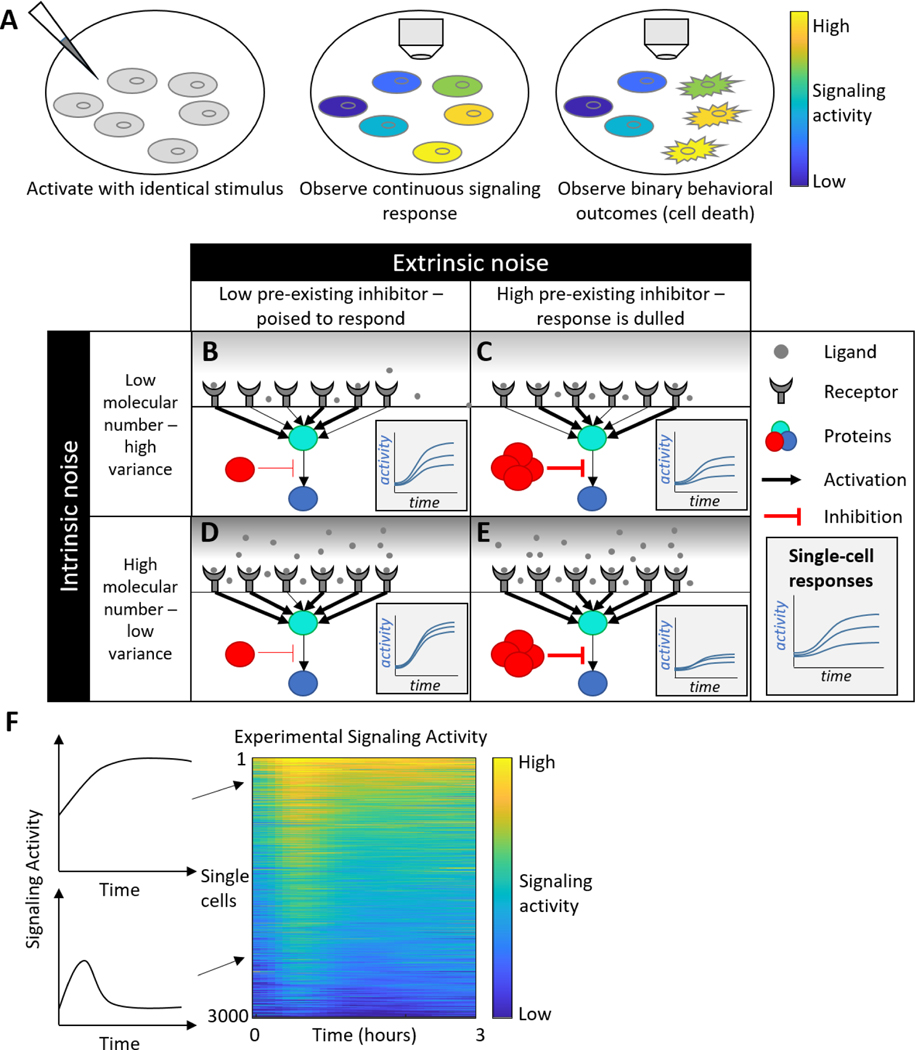
Figure 1:
Sources of heterogeneity. A) Cells can exhibit continuous variation, for instance in signaling response (middle). This continuum may be converted into binary outcomes for phenotypes like cell death. B-E) Comparing the effects of intrinsic and extrinsic noise. Columns represent two cells in different pre-existing states based on the amount of an inhibitory protein in the cell. Rows represent differences in ligand concentration, with low ligand concentration leading to significant differences in response based on stochasticity of receptor-ligand binding. Insets represent signaling responses in 3 separate cells for each condition. F) A kymograph or colormap is commonly used to represent single-cell signaling data. Left: Two individual cell responses, one sustained and one transient. Right: A kymograph summarizing responses of 3000 cells.

