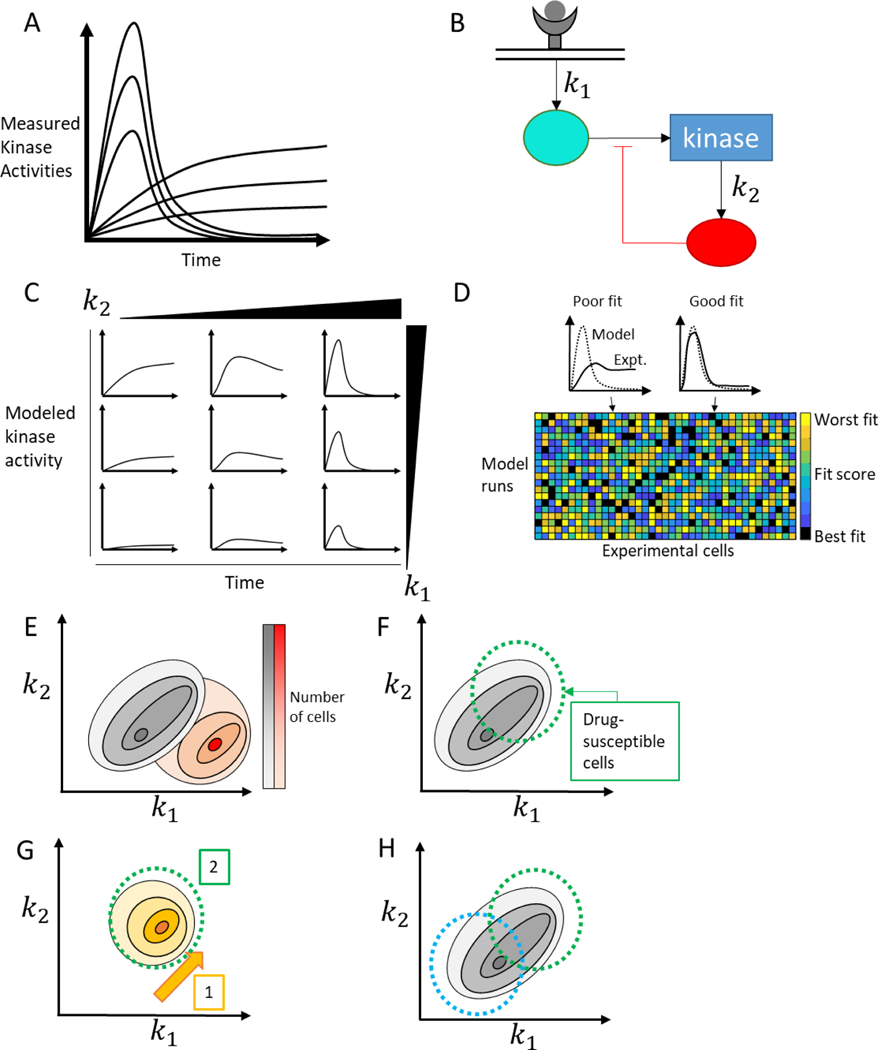
Figure 3:
Mechanistic modeling of heterogeneous signaling data. A) Heterogeneous single cell responses can differ in both magnitude and shape, with some cells exhibiting a sustained peak and others a transient response. B) A simplified schematic of an ODE model which can be used to study the heterogeneity shown in A. Two rate constants, k1 and k2, out of many are identified. C) Systemic variation of parameters in the model shows that k1 increases the magnitude of the response, while changes in k2 tune the duration of the response. D) Model and experimental outputs can be compared (top) with different cells fitting well with different model outputs. This procedure can be completed for all cell/model combinations (bottom) to extract a parameter set which represents the pre-existing cell state. E) Model-based inference of parameter values – and therefore cell state - enables population of cells to be placed on a spectrum of heterogeneous mechanistic processes, and compared between two different experimental conditions (black distribution vs. red distribution). F) Understanding cell state can provide mechanistic explanations for why some subpopulations of cells are sensitive to a drug and others aren’t. Treating with a drug that only targets some of the cells (green circle) will leave behind an insensitive population of cell. G) Using this knowledge, we can combine drugs temporally, giving one drug (orange) to sensitize the entire population to a second drug (green). H) We can also combine drugs (blue and green) to target two subpopulations simultaneously, eliminating the whole population of cells.

