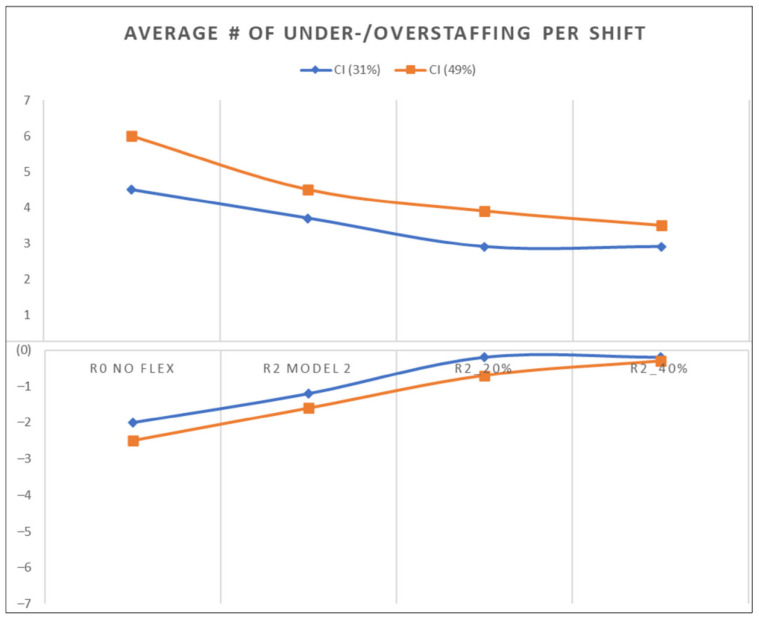
Figure 6.
Results of the R2 modifications. The X-axis is the number of nurses, and the Y-axis is the different scenarios, including R0, R2, R2 with a 20% float pool, and R2 with a 40% float pool. The blue line represents the actual demand condition (CI:31%), while the red line represents highly variable demand (CI = 49%).

