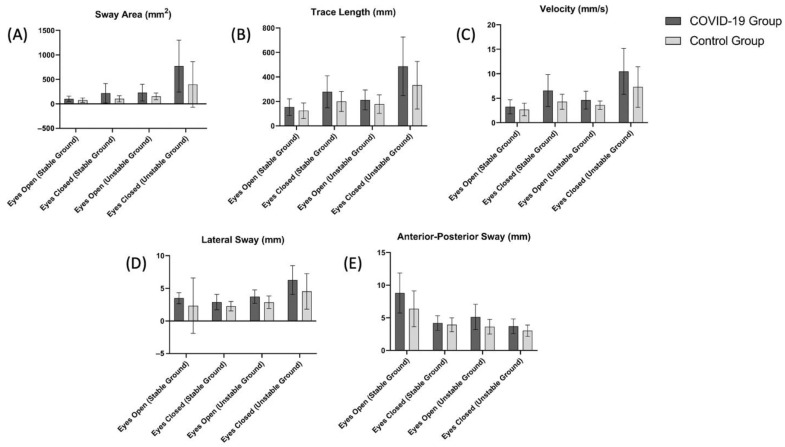
Figure 3.
Comparison of (A) sway area (eyes open (stable ground), p = 0.049; eyes closed (stable ground), p = 0.009; eyes open (unstable ground), p = 0.038; eyes closed (unstable ground), p = 0.010), (B) trace length (eyes open (stable ground), p = 0.11; eyes closed (stable ground), p = 0.01; eyes open (unstable ground), p = 0.11; eyes closed (unstable ground), p = 0.01), (C) velocity (eyes open (stable ground), p = 0.14; eyes closed (stable ground), p = 0.003; eyes open (unstable ground), p = 0.01; eyes closed (unstable ground), p = 0.01), (D) lateral sway (eyes open (stable ground), p = 0.18; eyes closed (stable ground), p = 0.02; eyes open (unstable ground), p = 0.003; eyes closed (unstable ground), p = 0.01), (E) anterior-posterior sway eyes open (stable ground), p = 0.02; eyes closed (stable ground), p = 0.002; eyes open (unstable ground), p = 0.39; eyes closed (unstable ground), p = 0.004) scores between the COVID-19 and control groups.

