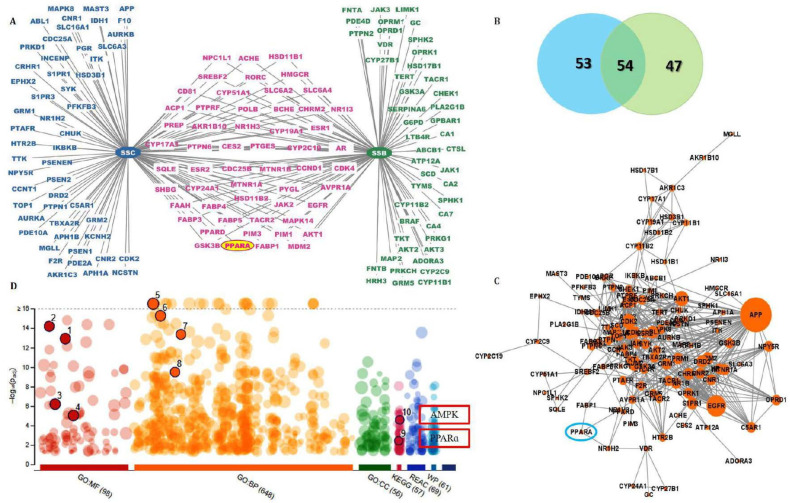
Figure 2.
The network pharmacological analysis between soyasapogenol B and soyasapogenol C. (A) Target network prediction of SSB and SSC; (B) the Venn diagram of the targets of SSB–SSC; (C) Protein–protein interactions of the overlapped targets between SSB and SSC; (D) The enriched KEGG pathways of the overlapped targets between SSB-SSC using g: Profiler. Numbering represents 1—Kinase activity; 2—Protein kinase activity; 3—Lipid binding; 4—Kinase binding; 5—Lipid metabolic process; 6—Lipid biosynthetic process; 7—Regulation of lipid metabolic process; 8—Lipid catabolic process; 9—PPARα signaling pathway; 10—AMPK signaling pathway.

