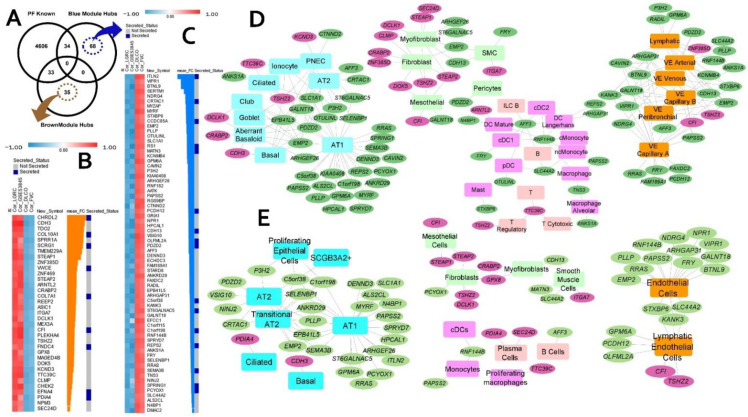
Figure 3.
Novel IPF candidate genes and their cell types (based on two IPF scRNA-seq datasets). (A) Venn diagram illustrating the overlap between intramodular hubs with a compiled set of known pulmonary fibrosis genes. (B,C) Heatmap representation of the IPF and lung function (FVC and DLCO) correlations of the 35 and 68 novel candidate genes from brown and blue modules, respectively. Also shown in the heatmap are their mean fold change in IPF and whether they encode known secretory proteins. Heatmaps were generated using the Morpheus application. Panels (D,E) represent the lung cell associations for the novel candidate genes using two different single-cell data sets from IPF. The pink and green ellipses represent genes from brown (upregulated in IPF) and blue (downregulated in IPF) modules, respectively. The rectangular nodes are different cell types. The cell types are color coded based on their broad cell type, namely, blue for epithelial, light green for mesenchymal, light, and deep pink for lymphoid- and myeloid-immune, respectively, and orange for endothelial cell types. Networks are generated using Cytoscape application.

