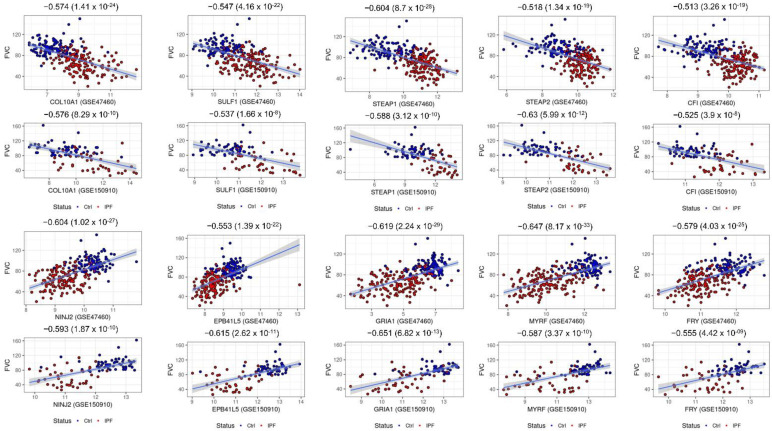
Figure 4.
Scatter plots of select candidate hub genes associated with lung function (FVC). Each plot includes sample FVC measures as a function of expression values of intramodular hub genes. All the plots are annotated by the correlation values between the sample FVC measure and the sample expression profile for each gene. Scatter plots for five genes each from the brown (COL10A1, SULF1, STEAP1, STEAP2, and CFI) and blue (NINJ2, EPB41L5, GRIA1, MYRF, and FRY) modules and their FVC correlations from two independent IPF cohorts are shown. Student’s asymptotic p-value for given correlations is also included.

