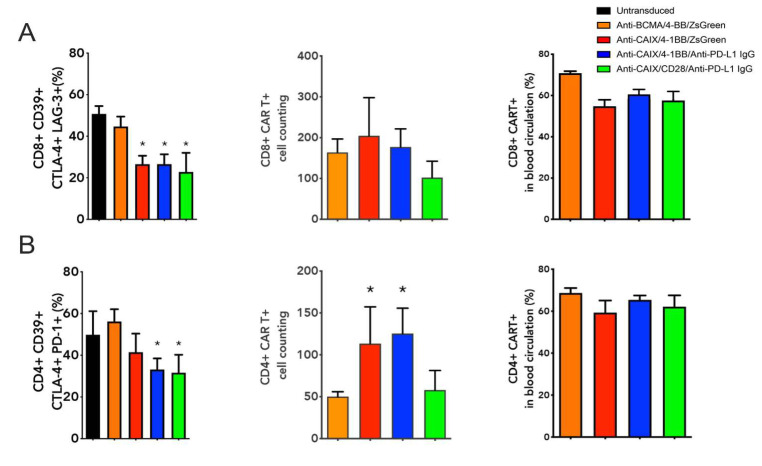
Figure 3.
Immune profile of live peripheral CD8 and CD4 chimeric antigen receptor (CAR) T cells one month after the first T cell transfer. (A) Boolean analysis of all T cell exhaustion markers (CD39, CTLA-4, TIM-3, and PD-1) expressed by CD8 T cells; absolute cell count of CD8+ CAR T cells within gated live cells; and percentage of live peripheral CD8+ CAR T cells. (B) Boolean analysis of all T cell exhaustion markers (CD39, CTLA-4, TIM-3, and PD-1) expressed by CD4+ T cells; absolute cell count of CD4+ CAR T cells within gated live cells; and percentage of live peripheral CD8+ CAR T cells. Data determined by flow cytometry. * p < 0.05 compared to anti- B cell maturation antigen (BCMA) CAR.

