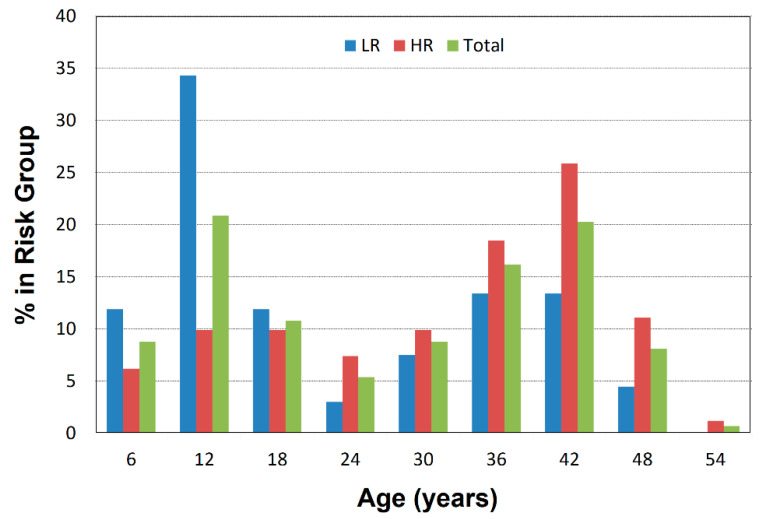
Figure 1.
Age Distributions for High- and Low-Risk Groups. The percentage of participants in each risk group who are found in each age bin is plotted against age in 6-year bins. Plots are shown separately for the low-risk group, high-risk group, and the total sample. The 7–12-year age bin has more low-risk than high-risk children.

