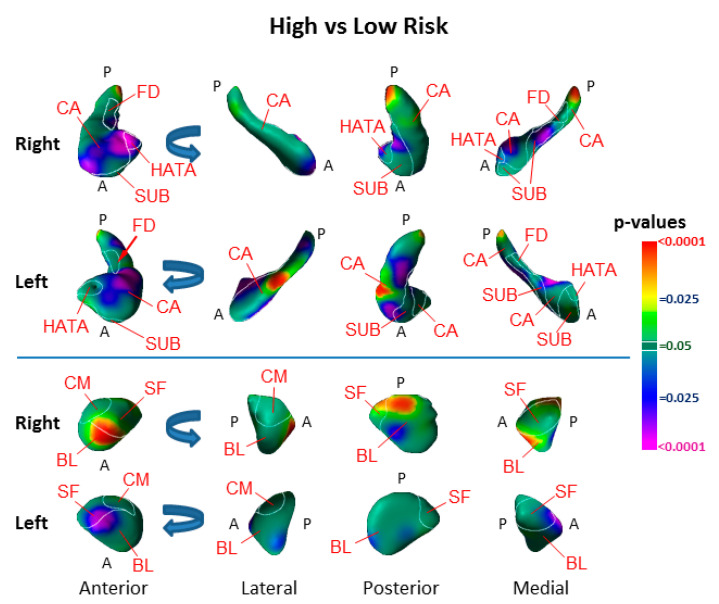
Figure 2.
Main Effect of Risk Group on Surface Morphologic Features. The right and left hippocampus and amygdala are shown in their anterior, lateral, posterior, and medial views, with the overlaid cytoarchitectonic map shown in the thin white outlines. Anterior (A) and posterior (P) positions are indicated. Arrows in the rotational views show the direction of rotation. The statistical significance (probability values) of differences in surface morphology across risk groups (81 high-risk, 67 low-risk participants) are color coded at each point on the hippocampal and amygdala surfaces. The color bar indicates the color coding for p-values associated with the main effect of risk group, with warmer colors (yellow and red) indicating protruding surfaces, presumably from larger underlying volumes, and cooler colors (blue and purple) indicating indented surfaces and presumably smaller underlying volumes in those regions. p-values are thresholded at p < 0.05 after correction for multiple comparisons using FDR. The statistical model included the main effect of risk group and the covariates of age, age2, and sex. Abbreviations: A—anterior; P—posterior; CA—cornu ammonis; SUB—subiculum; FD—fascia dentata; HATA—hippocampal–amygdaloid transition area; BL—basolateral nucleus; SF—superficial nucleus; CM—centromedial group.

