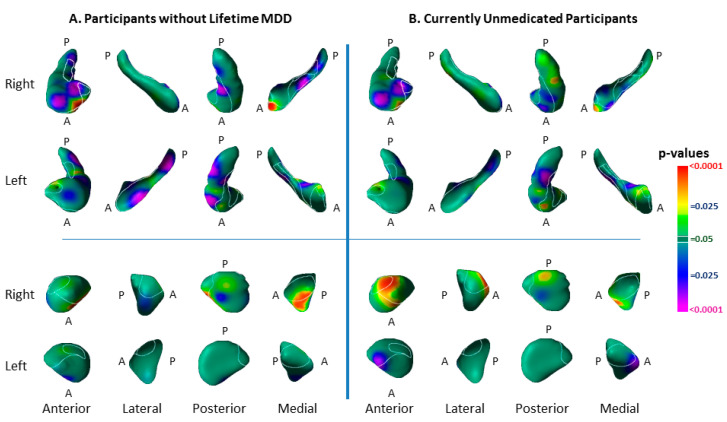
Figure 4.
Risk-group Effect Distinct from the Effect of Lifetime Major Depressive Disorder and Medication Use. Panel (A): The risk-group effect (32 HR vs. 55 LR) is shown when excluding all participants who had a lifetime history of MDD. Findings for the hippocampus are very similar to the effects when including all participants (Figure 1 of the main text), demonstrating that the surface morphological features for that structure are genuine risk effects, as they are detected in offspring of persons with MDD but who, themselves, have never had depressive illness. Many of the findings in the amygdala shown in Figure 1 of the main text, however, are not statistically significant in this subgroup analysis, either because those effects derive from the effects of lifetime MDD or because of the reduced statistical power in this analysis because of the smaller numbers of participants in this subgroup analysis. Panel (B): The risk-group effect (57 HR vs. 59 LR) is shown when excluding all participants who were taking psychotropic medications at the time of MRI scanning. The effect of risk group is similar to the effects detected when including all participants (Figure 1). These findings demonstrate that the risk effects reported Figure 1 are independent of medication effects. The statistical models included the main effect of risk group, and the covariates of age, age2, and sex. p-values are thresholded at p = 0.05 after FDR correction for multiple comparisons.

