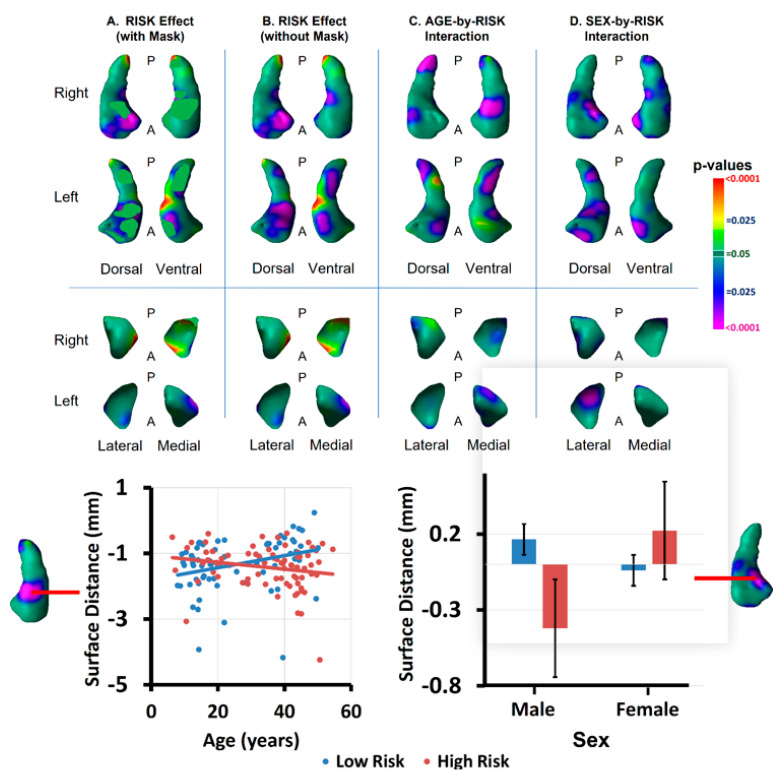
Figure 6.
Interactions of Risk Group with Age and Sex, and Residual Risk Effects. Panel (A): The effect of risk group is shown only in locations without significant age- or sex-by-risk-group interactions, which have been masked out of the statistical map. The significant main effects of risk group that remain are, therefore, independent of age and sex and are valid for all ages and both sexes. The independent variables were age, age2, sex, and risk group. Panel (B): The effect of risk group is shown without masking any interaction effects (as shown in Figure 2). The independent variables were age, age2, sex, and risk group. Panel (C): The effect of the age-by-risk-group interaction is shown at each voxel. Significant voxels were used to generate a mask that was then applied to the statistical map of Panel (A). Independent variables were age, age2, sex, risk group, and age-by-risk-group. The scatterplot at the bottom left indicates that the interaction derives from increasing protrusion with age in the LR group but greater indentations with age in the HR group. Panel (D): The effect of the sex-by-risk-group interaction is shown at each voxel. Significant voxels were used to generate a mask that was then applied to the statistical map of Panel (A). Independent variables were age, age2, sex, risk group, and sex-by-risk-group. The bar graph on the bottom right indicates that the interaction derives from greater indentations in the HR males than in the other participants.

