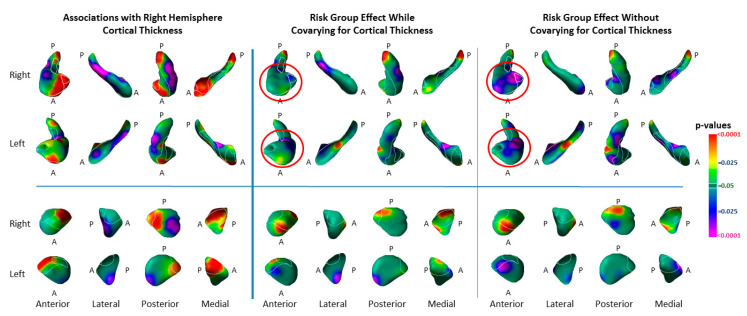
Figure 8.
Associations of Right-Hemisphere Cortical Thickness with Surface Morphologic Features of the Hippocampus and Amygdala. Left Panel: The statistical significance (p-values) for the associations of an index for right-hemisphere cortical thickness with surface measures on each structure are shown. Significant positive associations are in warm colors. Inverse associations are in cool colors. The index for right-hemisphere cortical thickness was calculated by averaging cortical thickness measures at each voxel within the voxels of the lateral surface of the right hemisphere, where thickness differed significantly between the high and low-risk groups. Statistical models included the independent variables cortical thickness, risk group, age, age2, and sex. Associations are shown for high- and low-risk groups combined (HR (64) and LR (65)). Middle Panel: This shows the effects of risk group while covarying for the average cortical thickness in voxels of the cortex where thickness differed significantly between risk groups, as well as covarying for age, age2, and sex. Right Panel: For ease of comparison with the middle panel, this shows the same effects without covarying for cortical thickness (also shown in Figure 1). The magnitude of cortical thinning accounted for most of the variance of the risk-group effect for indentations in the hippocampus (red circles), but not in the amygdala. Number of participants: covarying for cortical thickness—HR 63, LR 65; without covarying for cortical thickness—HR 81, LR 67.

