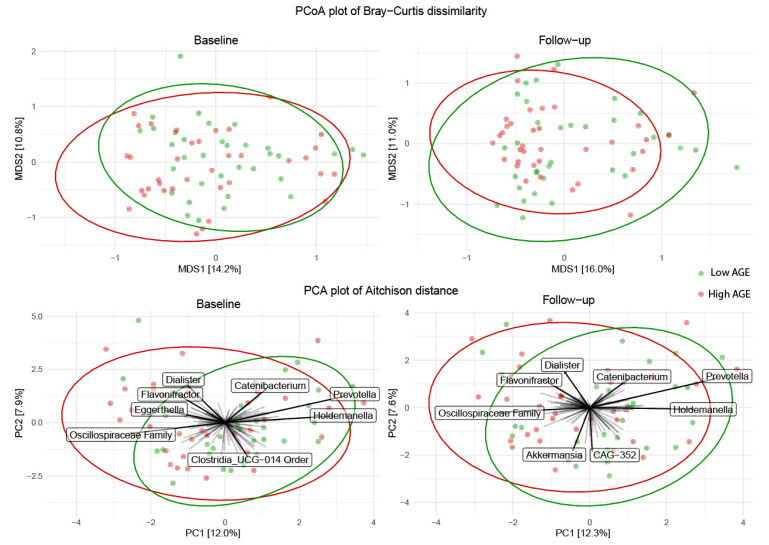
Figure 3.
Measures of beta-diversity before (left column) and after (right column) a low- or high-AGE diet in abdominally obese individuals. Upper row: principle coordinate analysis of Bray–Curtis dissimilarity. Lower row: Principle component analysis of the Aitchison distance. Sample sizes: low-AGE group n = 34, high-AGE group n = 36.

