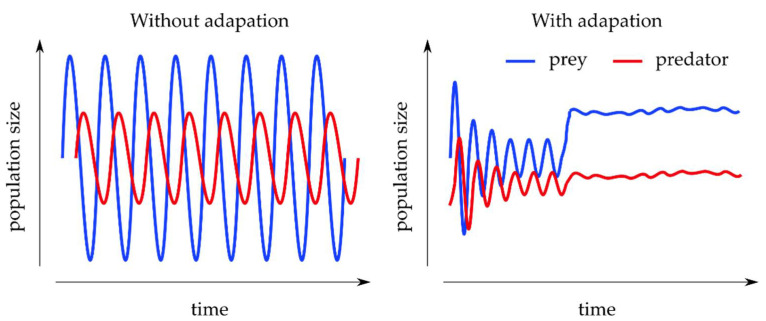
Figure 4.
Schematic of adaptive learning in predator–prey models. Left: A typical predator–prey model simulation based on Equation (5), characterized by persistent population size oscillations of both predator and prey, where peaks in prey precede peaks in predator populations. Right: Predator–prey model simulations with learned adaptive coevolution of both predator and prey based on Equation (6) and the work done by Park et al. [106], characterized by initially dampened oscillations followed by only marginally oscillating, stable population sizes of both predator and prey.

