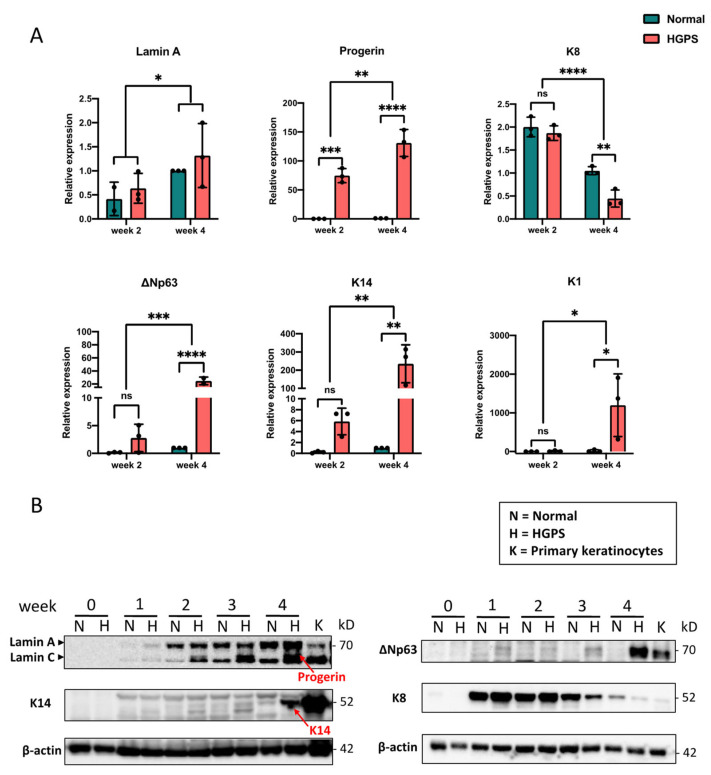
Figure 2.
The expression of keratinocyte markers during iPSCs-keratinocytes differentiation. (A) Quantitative RT-PCR analysis of the relative expression of Lamin A, progerin, ∆Np63, K14, K8, and K1 during normal and HGPS iPSCs-keratinocytes induction. Data were normalized to endogenous ACTB mRNA and to the average of Normal week 4. Data are presented as mean ± SD (n = 3). * p < 0.05, ** p < 0.01, *** p < 0.001, **** p < 0.0001, ns, not significant, two-way ANOVA followed by Tukey’s multiple comparisons test. (B) Western blot analysis of Lamin A/C (including progerin in HGPS-differentiated cells indicated by the red arrow), ∆Np63, K14 (indicated by red arrow), and K8 expression during normal and HGPS iPSCs-keratinocytes induction. Primary keratinocytes were used as a positive control. All experiments were repeated at least three times, and representative data are shown as indicated.

