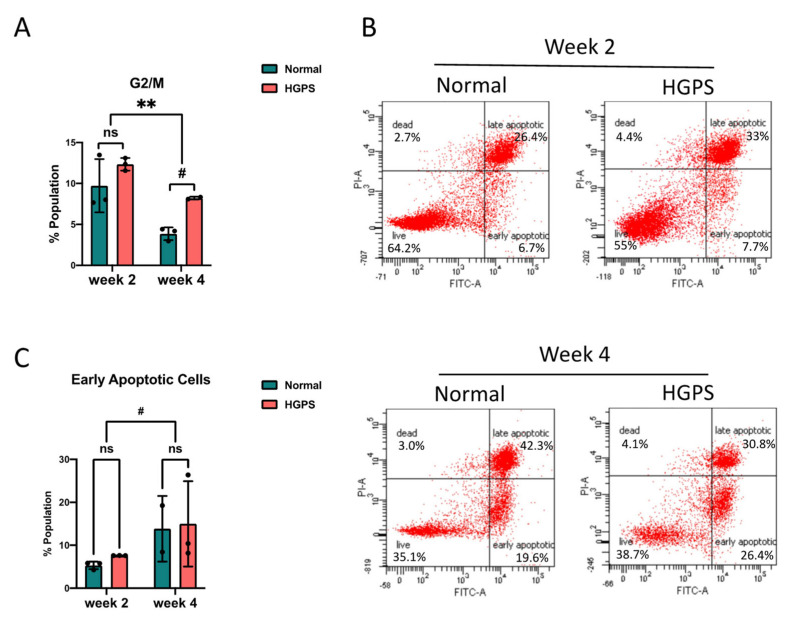
Figure 3.
Cell cycle and apoptosis during iPSCs-keratinocytes differentiation (A) Quantification of the G2/M phase cell cycle partitioning during normal and HGPS iPSCs-keratinocytes induction. Data are presented as mean ± SD (n = 3). # p < 0.1, ** p < 0.01, ns, not significant, two-way ANOVA followed by Tukey’s multiple comparisons test. (B) Representative flow cytometry plots showing PI–annexin V apoptosis assay during normal and HGPS iPSCs-keratinocytes induction. The gates were set according to the positive and negative controls as per the manufacturer’s instructions. The cells in the lower right quadrant were quantified as early apoptotic populations. (C) Percentage of early apoptotic cells by PI–annexin V flow cytometry analysis during normal and HGPS iPSCs-keratinocytes induction. Data are presented as mean ± SD (n = 3). # p < 0.1, ns, not significant, Two-way ANOVA followed by Tukey’s multiple comparisons test.

