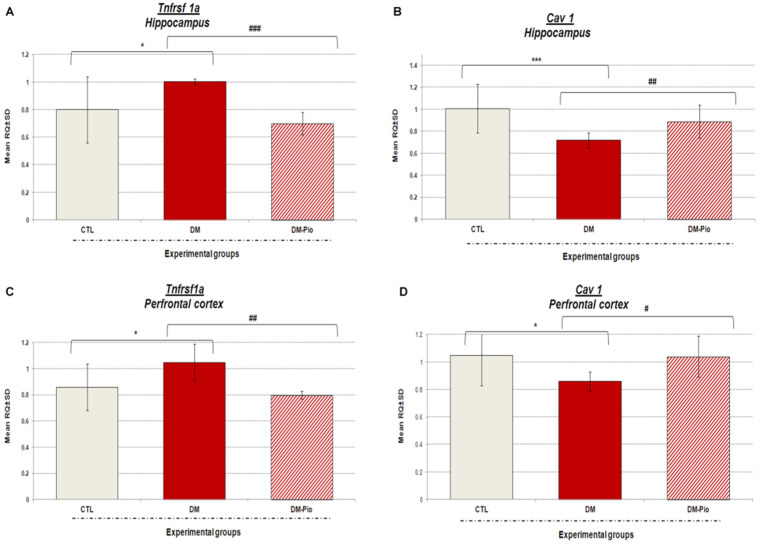
Figure 5.
Expression of mRNA levels of Tnfrsf1a and Cav1 in the hippocampus and prefrontal cortex of diabetic mice after 2 weeks treatment with pioglitazone. The bar height represents the mean ± SD for Tnfrsf1a and Cav1 gene expression in individual experimental groups: CTL: non-diabetic mice, DM: diabetic mice, DM-Pio: pioglitazone-treated mice [30 mg/kg, po] in the hippocampus (A,C) or prefrontal cortex (B,D) of mice. One-way ANOVA, followed by Tukey’s post hoc test was used. * p < 0.05; *** p < 0.001 in comparison with control group. # p < 0.05; ## p < 0.01; ### p < 0.001 in comparison with diabetes group.

