Figure 2.
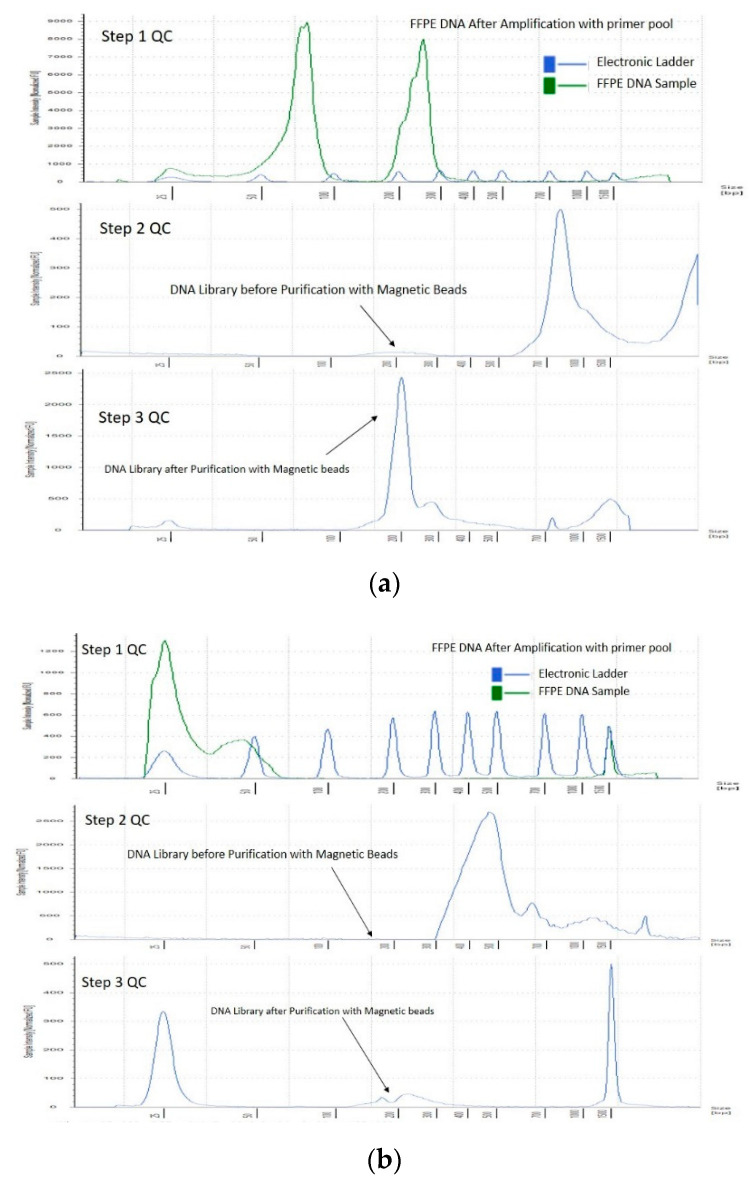
Three-step quality check of representative FFPE DNA samples. (a). Good on-target coverage DNA sample QC on TapeStation. (b) Poor on-target coverage FFPE DNA sample qc on TapeStation. Figure 2 shows a three-step quality check (QC) of representative FFPE DNA samples showing good and poor coverage on TapeStation, respectively. Step 1: QC after amplification with DNA primer pool, Step 2: QC after index adapter ligation to the amplified DNA sample, Step 3: Final library after purification with magnetic beads. The good coverage samples (a) had DIN: 5.9, DNA concentration: 110 ng/µL, library concentration: 170 nmol, average library size (bp): 230, coverage: 804×. The poor coverage sample (b) had DIN: 2.3, DNA concentration: 2.5 ng/µL, library concentration: 2.12 nmol, average library size (bp): 253, coverage: 3.5×.

