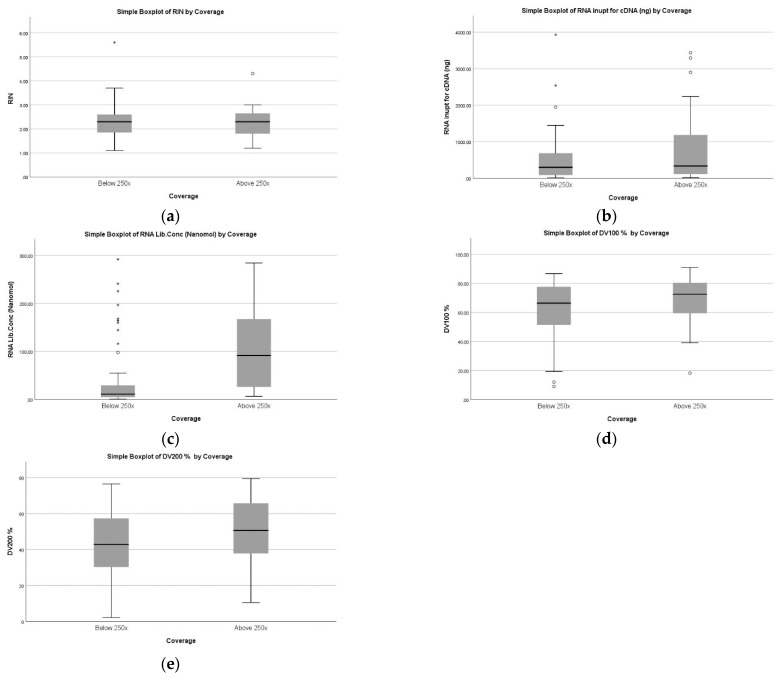
Figure 4.
Graphical representation of FFPE RNA samples according to NGS coverage. (a): RIN, (b): RNA input for cDNA, (c): RNA library concentration, (d): DV 100, (e): DV 200 (Left to Right). The figure describes a box plot of FFPE RNA samples coverage with respect to parameters such as RIN, RNA input for cDNA, RNA library concentration, DV 100, and DV 200. Only RNA library concentration (nanomol) was found to be significantly different between poor coverage (below 250×) and good coverage (above 250×). * represents the extreme data points, ◦ represents the ouliers data points.

