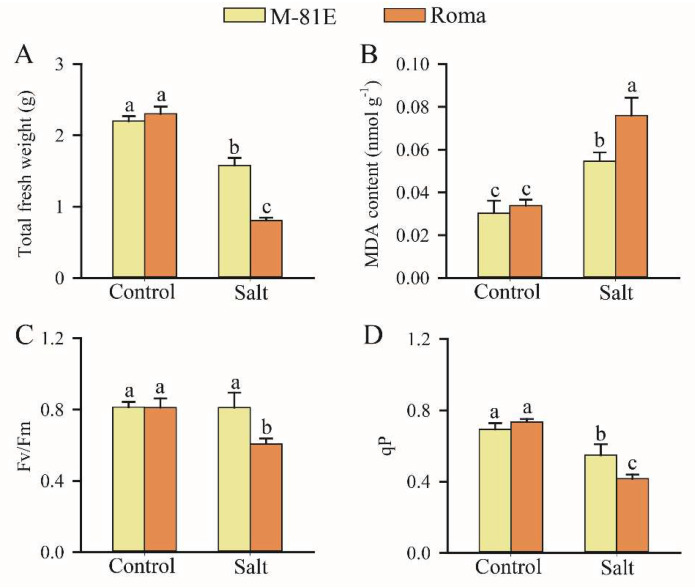
Figure 1.
Effect of salt stress on total fresh weight (A), MDA content (B), the maximum quantum yield of PSII (C), and qP (D) of salt-tolerant (M-81E) and salt-sensitive (Roma) genotypes. Each value represents the mean of 6 replicates ± SD. Different letters indicate a significant difference (p < 0.05) between the control and the treatment.

