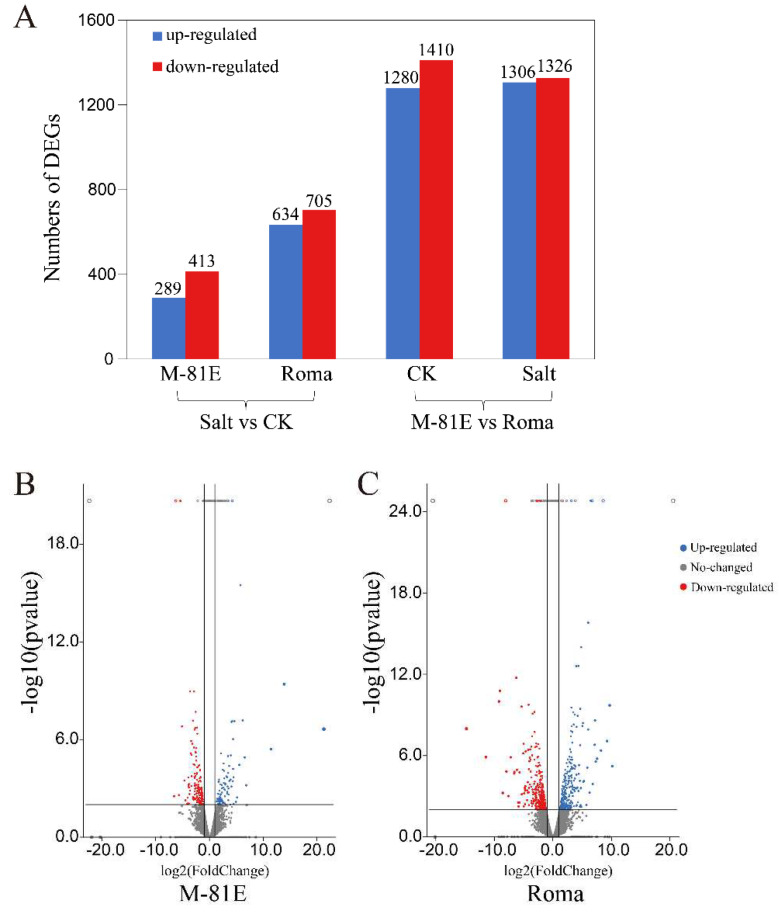
Figure 2.
Numbers of differentially expression genes (DEGs) of different genotypes when affected by salt stress. (A) DEG distribution of the two treatment groups under normal soil or salt stress conditions; (B) volcano plot showing DEGs for M-81E+salt and M-81E; (C) volcano plot showing DEGs for Roma+salt and Roma.

