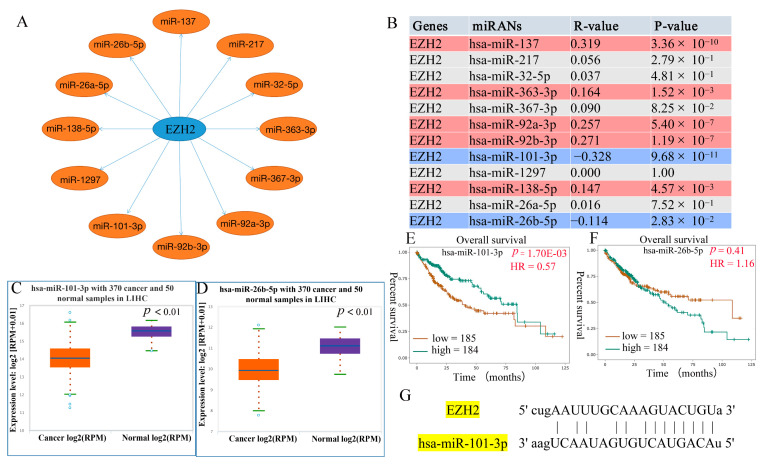
Figure 5.
Prediction and identification the potential upstream regulatory miRNAs of EZH2 in HCC. (A) The predicted miRNA-EZH2 network. (B) The correlation between the candidate miRNAs and EZH2 in HCC, where red represents a positive correlation and blue represents a negative correlation. (C,D) Differential expression analysis of hsa-miR-101-3p and hsa-miR-26b-5p in HCC tissues and normal tissues. (E,F) Prognostic analysis of hsa-miR-101-3p and hsa-miR-26b-5p in HCC. (G) Pairing information of hsa-miR-101-3p and EZH2.

