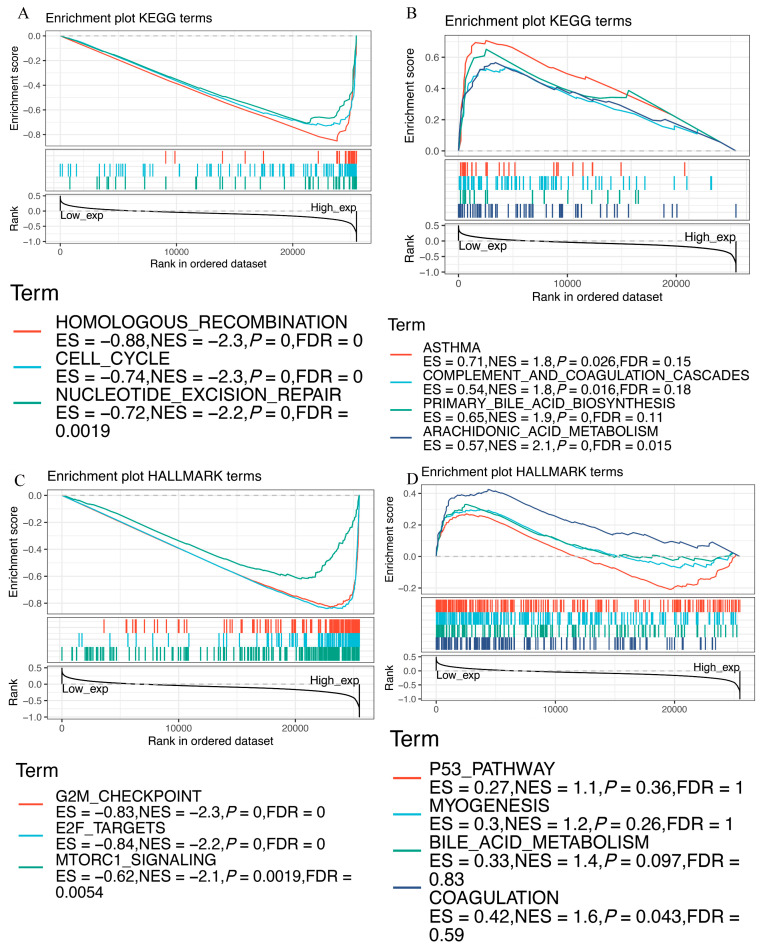
Figure 10.
GSEA for samples with high and low EZH2 expression. (A) Enriched gene sets in the KEGG collection by samples with high EZH2 expression. (B) Enriched gene sets in KEGG by samples with low EZH2 expression. (C) Enriched gene sets in the HALLMARK collection by samples with high EZH2 expression. (D) Enriched gene sets in HALLMARK by samples with low EZH2 expression.

