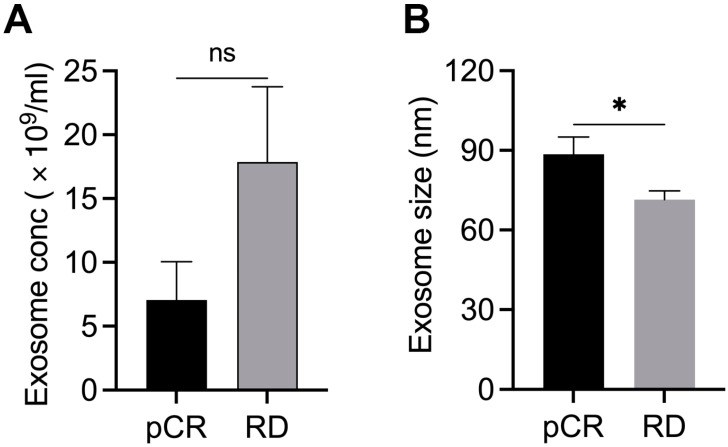
Figure 1.
Characterization of exosomes in plasma samples from patients with BC showing pCR (n = 8) or RD (n = 8) after NAC. Bar graphs showing the concentration (A) and mean size (B) of exosomes in patients with pCR or RD after NAC. Bars indicate mean ± SEM. Unpaired two-tailed Student’s t-test with Welch’s correction was used to determine statistical significance (ns, non-significant; * p < 0.05).

