Figure 2.
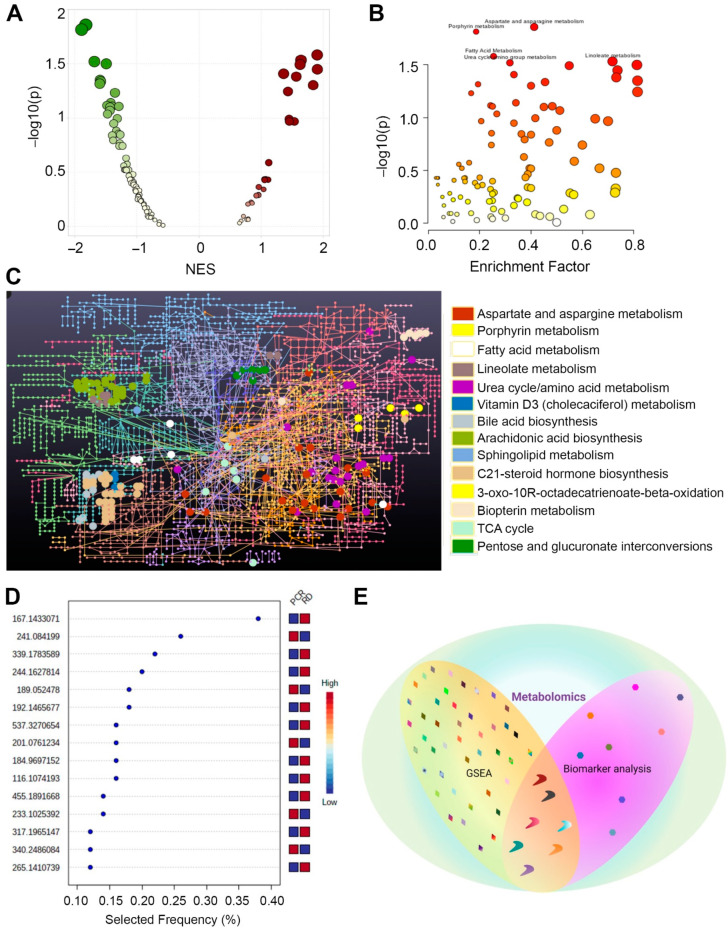
Differentially regulated metabolic pathways and metabolites in plasma exosomes of patients with pCR or RD after NAC. (A) Scatter plot showing metabolic pathways upregulated (maroon plots with positive NES) and downregulated (green plots with negative NES) in RD vs. pCR (analyzed using GSEA). The color intensity indicates the p-value, and the dot size indicates NES. (B) Scatter plot summarizing the pathways differentially enriched in patients with RD vs. patients with pCR after NAC; circles indicate matched pathways from user-uploaded data. The color intensity indicates the p-value, and the dot size indicates the enrichment score. (C) Network analysis showing metabolites in differentially regulated pathways in RD and pCR samples. Colors indicate different metabolic pathways, and circles indicate metabolites associated with a specific pathway. (D) Scatter plot showing the most important metabolites of a selected model ranked from most to least important (analyzed using biomarker analysis). (E) Venn diagram showing shared and differentially regulated metabolites identified by GSEA and biomarker analysis. Different shapes were used to differentiate the results of the two analyses. Colors are specific to metabolites that were differentially regulated in the two groups. NES, normalized enrichment score. This schematic was created using BioRender (Toronto, ON, Canada).

