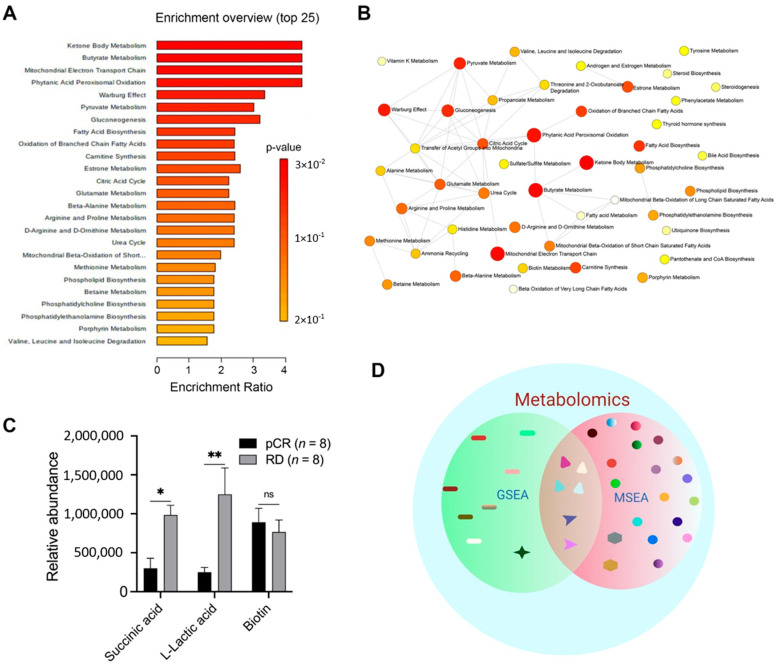
Figure 3.
Succinic acid and L-lactic acid are significantly upregulated in plasma exosomes of patients with RD after NAC. Differentially regulated metabolic pathways and metabolites were identified using MSEA. (A) Network showing metabolic pathways differentially regulated in patients with RD or pCR after NAC. (B) Summary plot showing the top 25 differentially enriched metabolic pathways. Each node represents a metabolite set with its color based on its p-value and its size based on number hits to submitted query. Two metabolite sets are connected by an edge if the number of their shared metabolites is over 25% of the total number of their combined metabolite sets. (C) Bar graphs showing the levels of various metabolites in patients with RD and those with pCR. (D) Venn diagram showing common metabolites identified using GSEA and MSEA. Bars indicate mean ± SEM. Two-way ANOVA with Sidak’s multiple comparison test was used to determine statistical significance. ns, non-significant; * p < 0.05; ** p < 0.005; The scheme in (D) was created using Bi-oRender, Toronto, ON, Canada.

