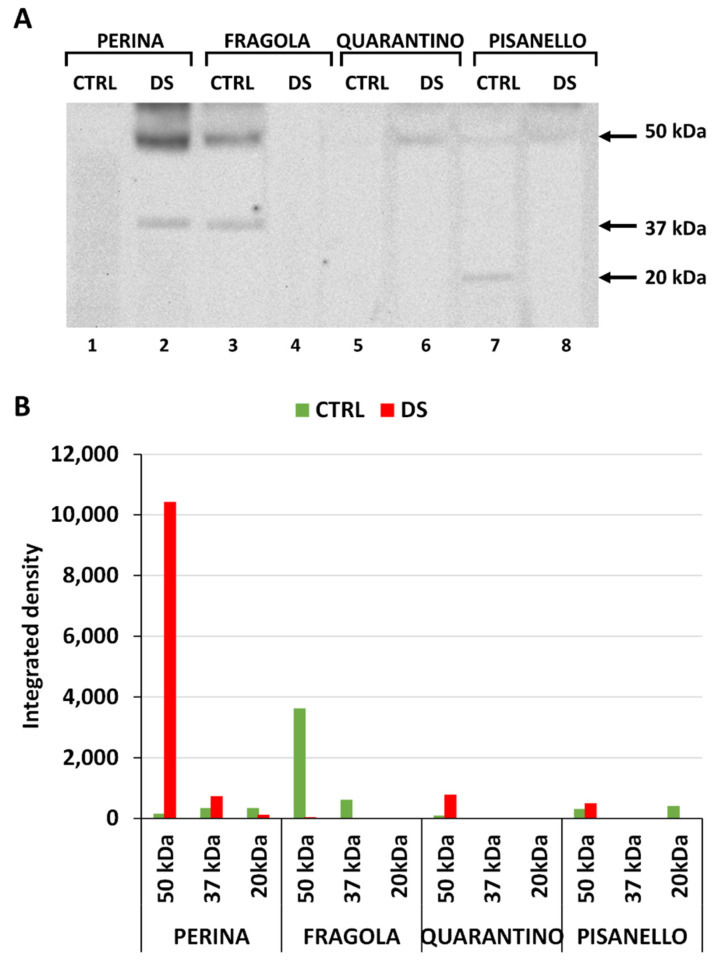
Figure 5.
Aquaporin content in leaves of the four tomato cultivars under both control and stressed conditions. (A) Immunoblotting with anti-aquaporin antibodies in the four cultivars, control samples (CTRL), and stressed samples (DS). On the right, molecular weights of the three main bands identified. (B) Relative quantization of blotting expressed as integrated density (y-axis). Green bars indicate control samples, red bars indicate drought-stressed samples.

