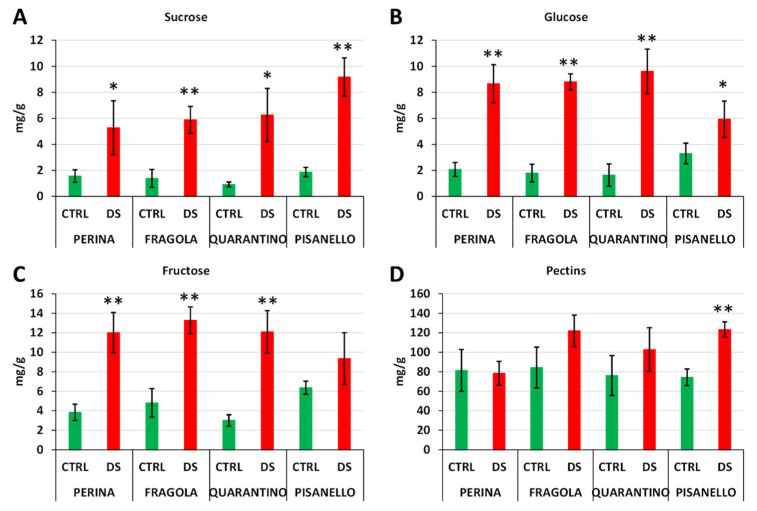
Figure 8.
Content in mg per g of sucrose (A), glucose (B), fructose (C) and water-soluble pectins (D) in leaves sampled from control (green bars) and drought stressed (red bars) plants belonging to four Tuscan tomato cultivars. Asterisk indicates significant difference between control and stressed plants with p ≤ 0.05 (*) or p ≤ 0.01 (**).

