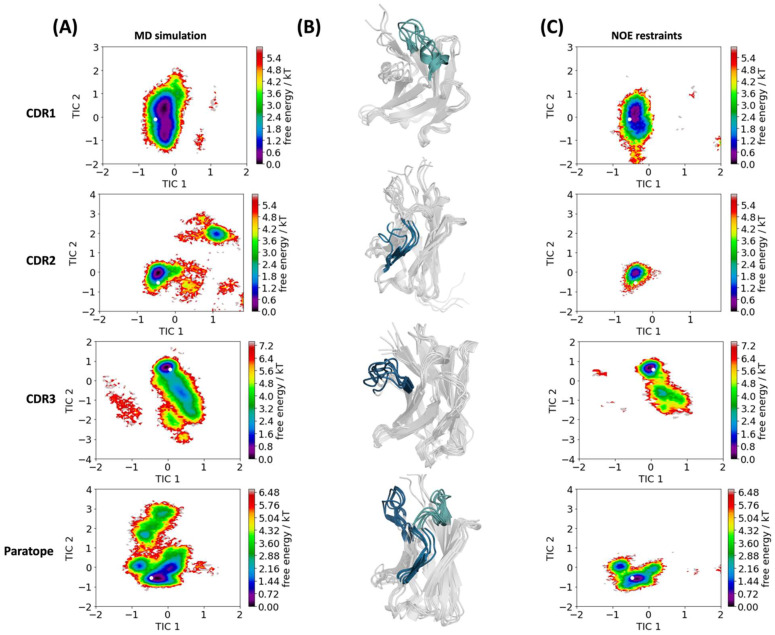
Figure 2.
Free energy surfaces of the simulated MD ensemble (A) and the simulated NMR ensemble (C). Combined tICA of the simulated MD ensemble and the simulated NMR ensemble was performed to generate kinetic coordinate systems for each CDR loop and the whole paratope. tIC1 and tIC2 represent the directions of the two slowest movements of the system. The crystal structure is projected into these coordinate systems and illustrated as a white dot. (B)The respective structure representatives of the simulated MD ensembles are shown in the middle, focusing on the respective CDR loops.

