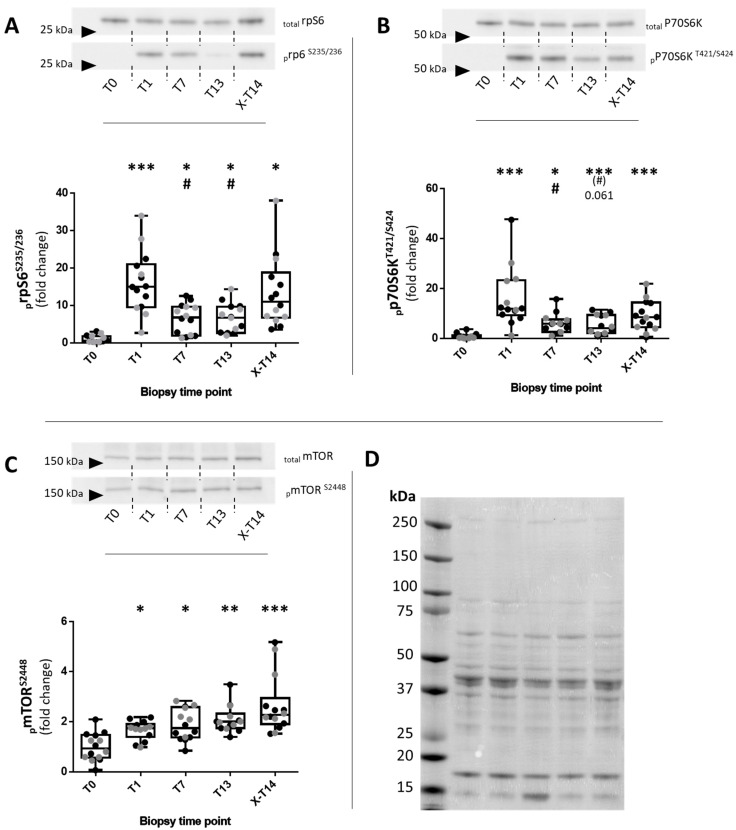
Figure 1.
Western blotting analysis of acute responses of phosphorylated and total levels of mTOR, p70S6k, and rpS6 in human skeletal muscle during repeated RE. Regulation of prpS6S235/236 (A), pp70S6kT421/S424 (B), and pmTORS2448 (C) at rest (T0), 45 min after the 1st RE session (T1), after the 7th (T7) and 13th RE sessions (T13), and after 10 days of detraining (X-T14). Upper panel: Representative images of membranes probed for the respective proteins (phospho- and total protein). Lower panel: Box–whisker plots for the individual proteins: upper whisker (max), lower whisker (min), upper box (75th percentile), lower box (25th percentile), and median. pmTORS2448, pp70S6kT421/S424, and prpS6S235/236 were normalized to the total protein levels for each time point and individual subject. Normalization to the baseline (T0) was performed by dividing all time points of individual subjects by the total average of T0. Differently colored points represent data from individual subjects from the PR (gray dots) and CO (black dots) groups. * p < 0.05; ** p < 0.01; *** p < 0.001 with respect to T0; # p < 0.05 with respect to T1. (D) A Ponceau-S-stained PVDF membrane that was previously subjected to Western blotting and with samples of a representative subject showing all five time points.

