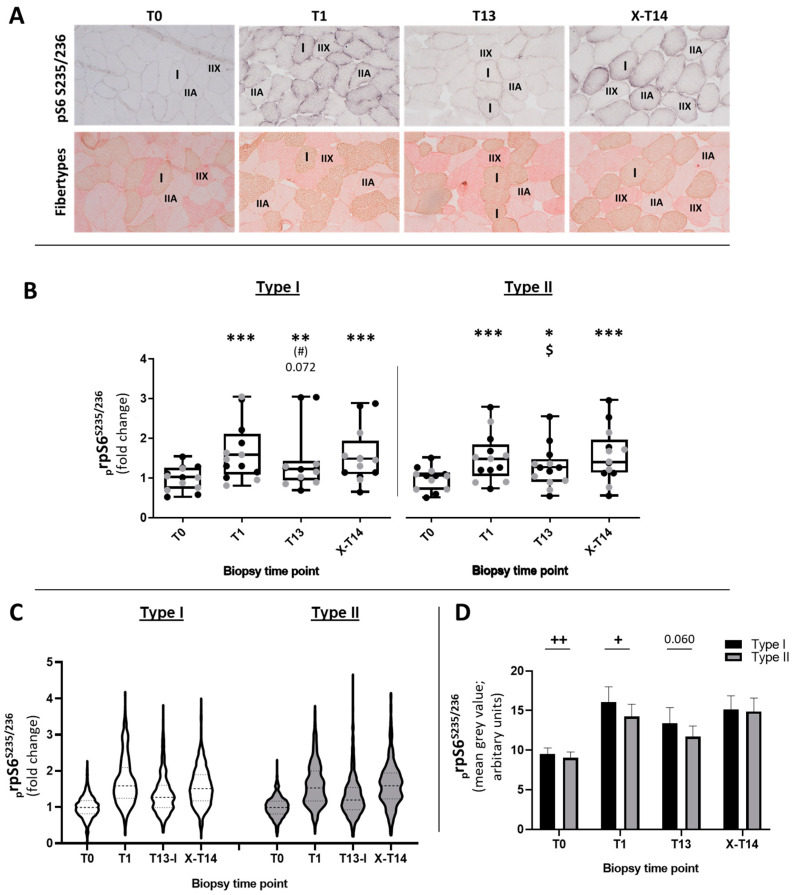
Figure 2.
Quantification of the sarcoplasmic prpS6S235/236 staining intensity in type I and II myofibers as determined via densitometry. (A) Representative images of muscle cross-sections (20-fold magnification) from one subject stained for prpS6S235/236 (upper row of pictures) and the consecutive cross-section stained for type I (red–brown), type IIA (pale red), and IIX (full red) stained myofibers. (B) Box–whisker plots for all analyzed type I and II myofibers stained for prpS6S235/236: upper whisker (max), lower whisker (min), upper box (75th percentile), lower box (25th percentile), and median. Fiber-type-specific prpS6S235/236 data were normalized to the baseline (T0) by dividing all time points of individual subjects by the total average of T0. Differently colored points in the graphs represent data from individual subjects from the PR (gray dots) and CO (black dots) group. * p < 0.05; ** p < 0.01; *** p < 0.001 with respect to T0; # p < 0.05 with respect to T1; $ p < 0.05 with respect to X-T14 (C) Violin plots displaying the frequency of type I (white violins) and type II fibers (gray violins) with identical staining intensity of prpS6S235/236 (horizontal width of the violin corpus) and the variable staining intensity of prpS6S235/236 within the entire spectrum of analyzed fibers (y-axis). Normalization to the baseline was conducted by dividing the mean of all measured fibers of one subject and time point by the corresponding mean value of T0. (D) Direct comparison of prpS6S235/236 levels between type I and type II fibers over the time course; + p < 0.05; ++ p < 0.01 for the difference between fiber types.

