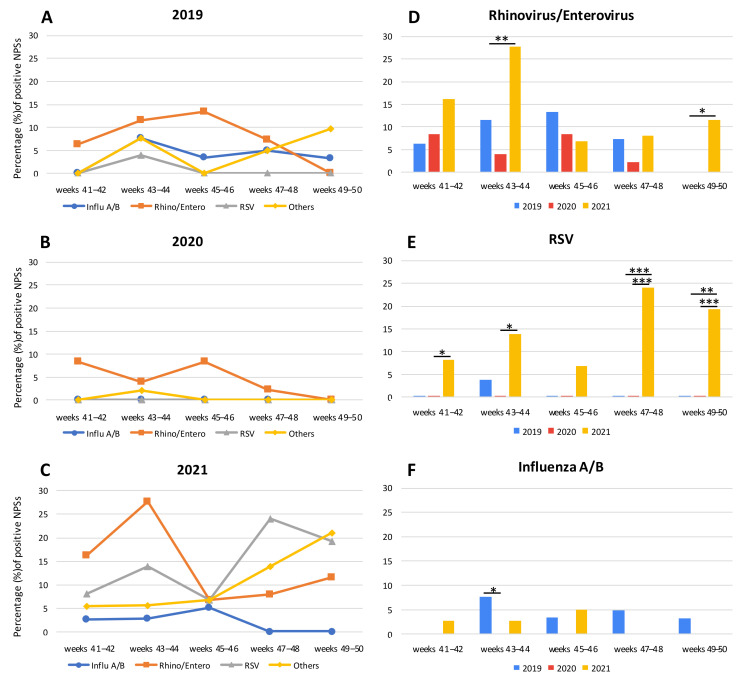
Figure 1.
Biweekly percentage of NPSs positive for CRPs during the fall season of 2019, 2020, and 2021. (A–C): Seasonal circulation of CRP-positive samples during fall 2019, 2020, and 2021, respectively. (D–F): Biweekly of CRP-positive samples in comparison with the same interval periods during 2019, 2020, and 2021. Asterisks indicate statistically significant differences determined by Student’s t test (*** = p < 0.001; ** = p < 0.01; * = p < 0.05; no asterisk = not significant).

