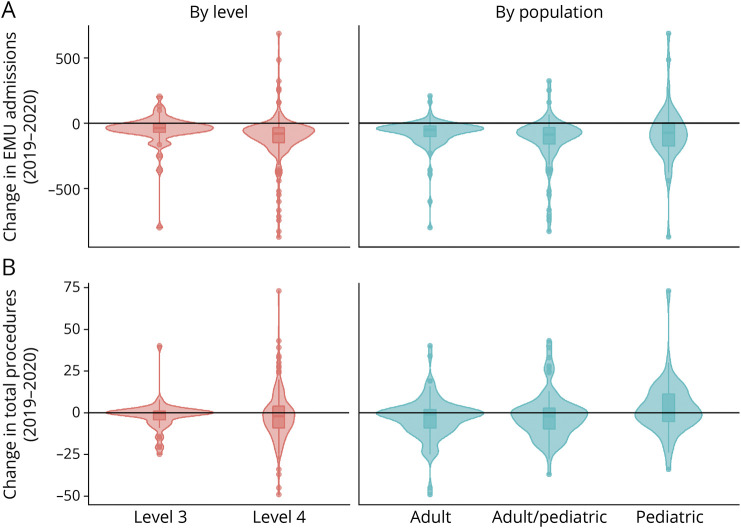
Figure 2. Changes in Epilepsy Monitoring Unit Admissions and Total Procedures by NAEC Level or Patient Population.
Changes in epilepsy monitoring unit (EMU) admissions (A) and total procedures (B) displayed by National Association of Epilepsy Center (NAEC) level or patient population. Violin plots by center level and overlaid box plots with median and interquartile range also show the smoothed density at different values. These plots include values of zero, as reported by the respondents.

