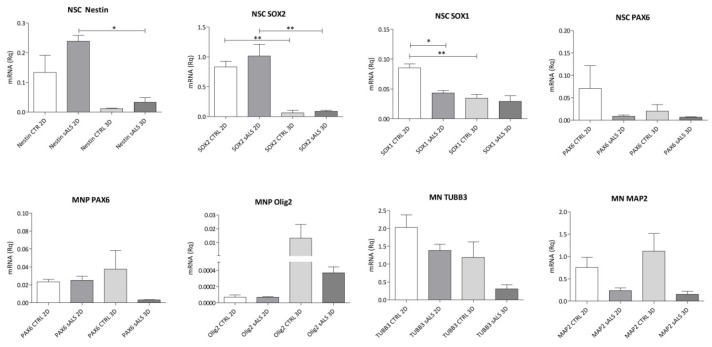
Figure 3.
RT-qPCR confirms the expression of the typical markers during differentiation. The differentiation was confirmed using the markers for NSCs (Nestin, SOX2, SOX1 and PAX6), MNPs (PAX6 and Olig2) and MNs (TUBB3 and MAP2). Error bars indicate SD. Data were analyzed using ANOVA, followed by the Bonferroni test. * p < 0.05; ** p < 0.01 (GraphPad Prism 8).

