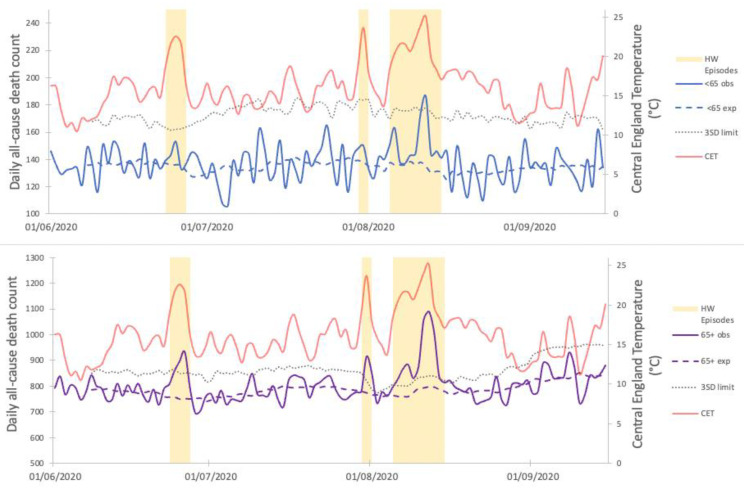
Figure 2.
Three mortality peaks associated with the heatwave events identified for both the <65 years group (top panel) and the 65+ years group (bottom panel). Both panels also display the calculated daily expected deaths (dashed lines) and the 3 standard deviation threshold used to determine significance (dotted line). Heatwave episodes are highlighted on both panels with CET included for context.

