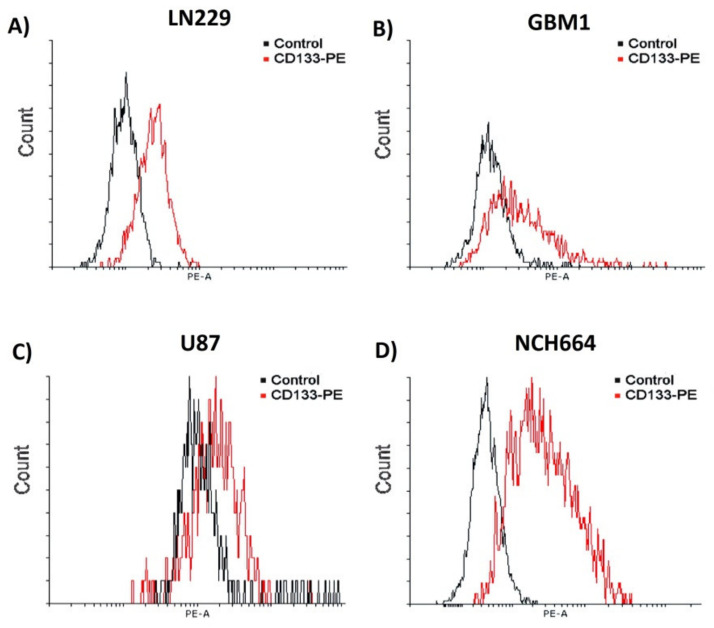
Figure 7.
Analysis of the amount of CD133 expression on glioblastoma cancer cells by FACS. Depicted are histograms of exemplary measurements of cells stained with CD133/AC133-PE. The cells have displayed different ratios of CD133 expression (A) LN229 = 33.8%, (B) GBM1= 33.1% (C) U87 = 21.5% and (D) NCH664 = 89.2%.

