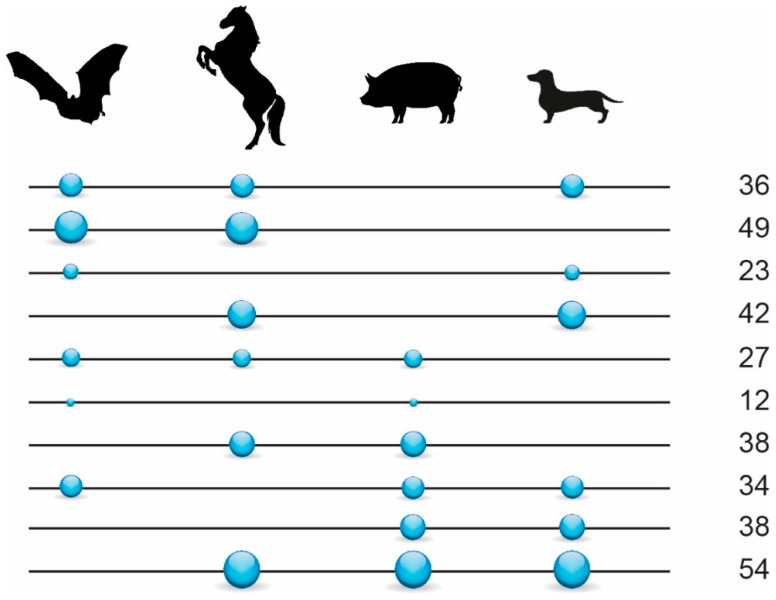
Figure 2.
Retrotransposon presence/absence markers in Scrotifera. Values on the right represent the total number of informative retrotransposon insertions found for the respective interordinal affiliations as indicated by the circles (e.g., 36 shared retrotransposons for Chiroptera, Perissodactyla, and Carnivora). Circles on lines represent the presence states of retrotransposons, and the lines without circles represent the absence states. The size of the circles reflects the relative number of diagnostic markers. We used only 353 markers diagnostic for Scrotifera (from 470 in total) for the 4-LIN analysis (represented in the figure).

