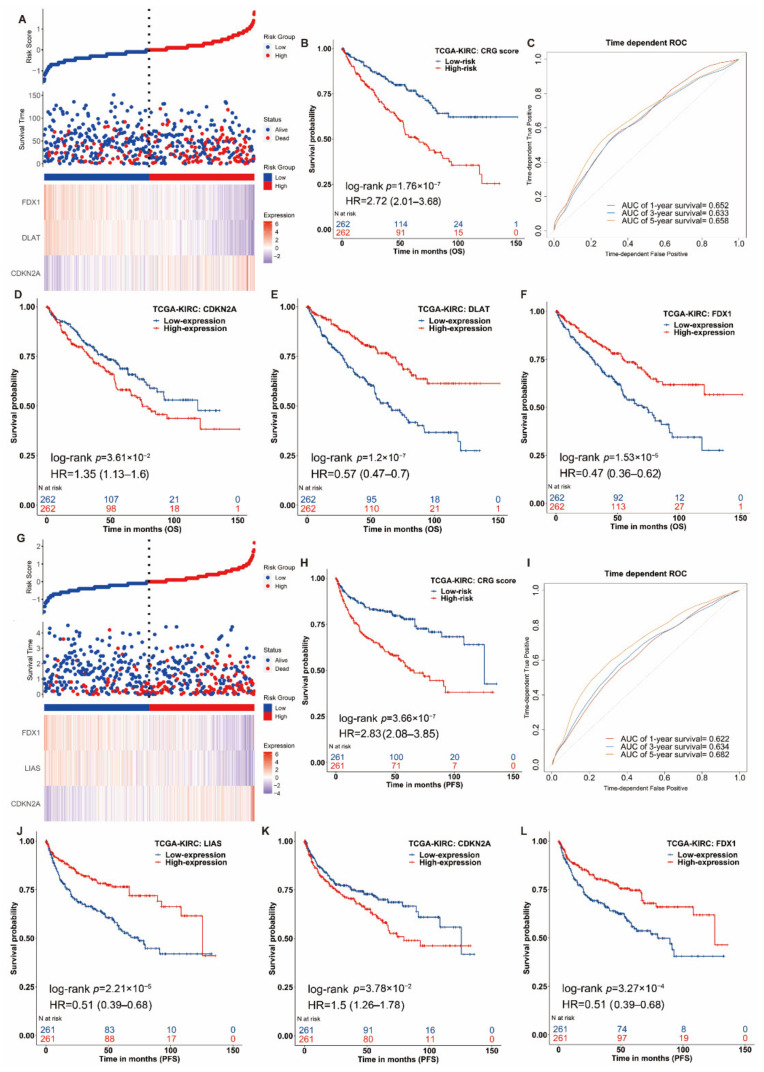
Figure 3.
Clinical relevance of CRGs in the ccRCC patients of TCGA. For OS outcome, (A) distribution of risk score, survival status and the expression of prognostic CRGs, (B) Kaplan−Meier plot of the CRG signature and overall survival, (C) ROCs for one-year, three-year and five-year survival prediction. Kaplan−Meier plot for the expression of (D) CDKN2A (E) DLAT and (F) FDX1 and overall survival. For PFS outcome, (G) distribution of risk score, status and the expression of prognostic CRGs, (H) Kaplan−Meier plot of the CRG signature and progression-free survival. (I) ROCs for one-year, three-year and five-year progression-free survival prediction. Kaplan−Meier plots of the expression of (J) LIAS, (K) CDKN2A and (L) FDX1 and progression-free survival. The hazard ratios (HRs) are evaluated by Cox proportional hazard models. OS: overall survival, PFS: progression-free survival and ROC: receiver operating characteristic curve.

