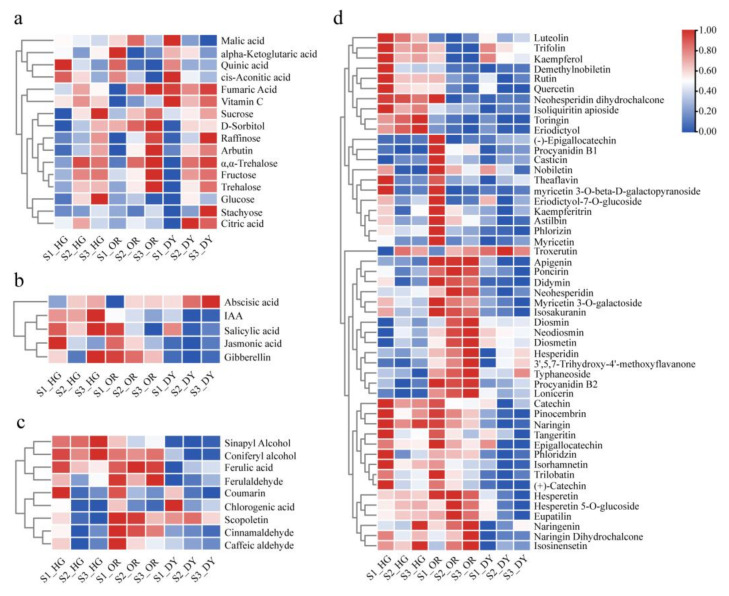
Figure 4.
Patterns of accumulation of metabolites involved in (a) sugars and organic acids, (b) plant hormones, (c) lignin synthesis, and (d) flavonoid biosynthetic pathways. In the heat map, the rows represent metabolites and the columns represent samples. Colors indicate the level of metabolite accumulation in different samples. The gradation in color (from blue to white to red) indicates low to high levels of metabolites.

