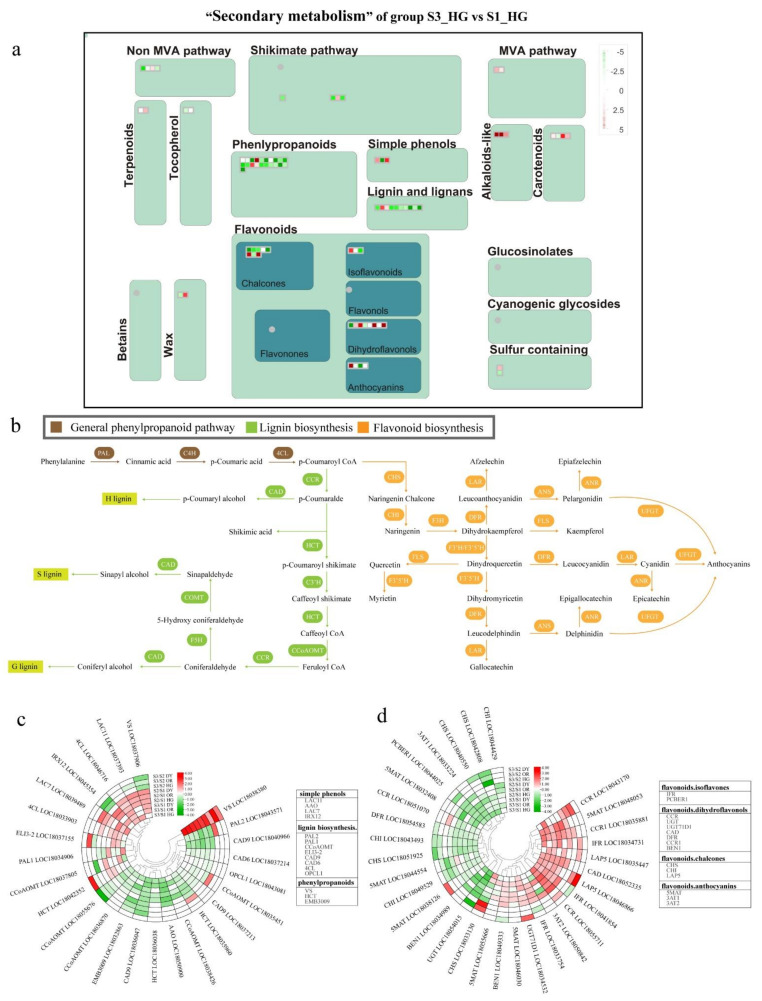
Figure 8.
(a) MapMan-based “metabolic overview map” of DEGs in the “S3_HG vs. S1_HG” group, including modules for phenyl propane, lignans, flavonoids, mangiferylic acid, and wax. The small heat map in each section of the figure shows the DEGs mapped to that pathway, with a small square indicating a gene. The color of the square indicates the expression of that gene in the third stage, down-regulated in green and up-regulated in red. (b) General phenylpropanoid metabolism, lignin biosynthesis, and flavonoid biosynthesis metabolic pathways in citrus. Differentially expressed genes associated with (c) monophenol, phenylpropanoid, and lignin biosynthesis, and (d) flavonoid biosynthesis metabolism during fruit development and ripening. Red indicates up-regulation, and green indicates down-regulation. Heatmap of DEGs was drawn using the log2Foldchange value obtained from the pairwise comparison of samples. S3/S1, comparison group of S3 and S1; S2/S1, comparison group of S2 and S1; S3/S2, comparison group of S3 and S2. Red and green indicate up-regulation and down-regulation, respectively, in the former of the comparisons.

