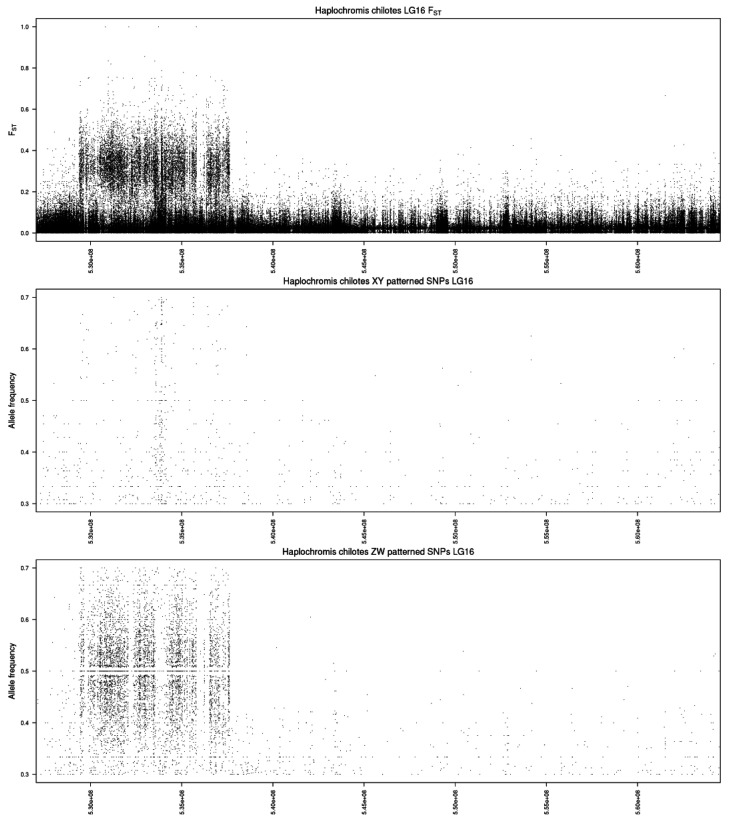
Figure 2.
Single chromosome plot for Haplochromis chilotes. The top panel shows values for FST. The middle panel shows the frequency of Y-patterned SNPs in the male pool. The bottom panel shows the frequency of W-patterned SNPs in the female pool. The x-axis is labeled with the coordinates of the Maylandia zebra UMD2a reference assembly.

