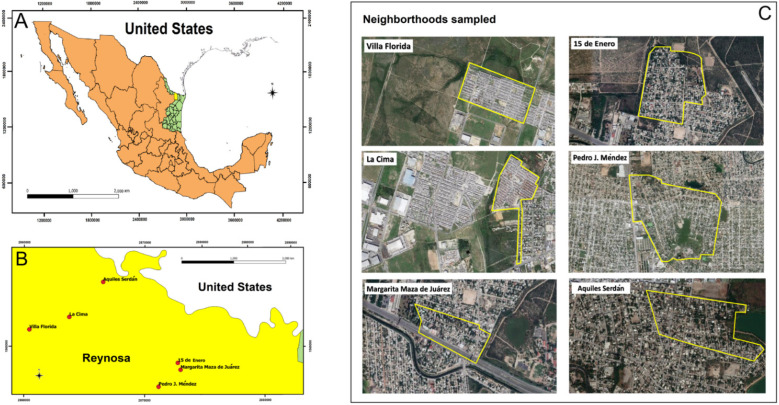
Figure 1.
(A) Green area shows the State of Tamaulipas in northeastern México. (B) Red dots show the locations of the neighborhoods that were sampled within the city of Reynosa, in the State of Tamaulipas. (C) Satellite images show the land use composition of the six sampled neighborhoods in Reynosa. Figures are original maps, created by the authors using QGIS 3.18.2 with public domain map data from INEGI, and satellite images from Google maps. (https://qgis.org/en/site/) (accessed on 15 September 2021) with public domain map data from INEGI (https://www.inegi.org.mx/app/mapas/) (accessed on 15 September 2021), and satellite images from Google maps (https://www.google.com.mx/maps) (accessed on 15 September 2021).

