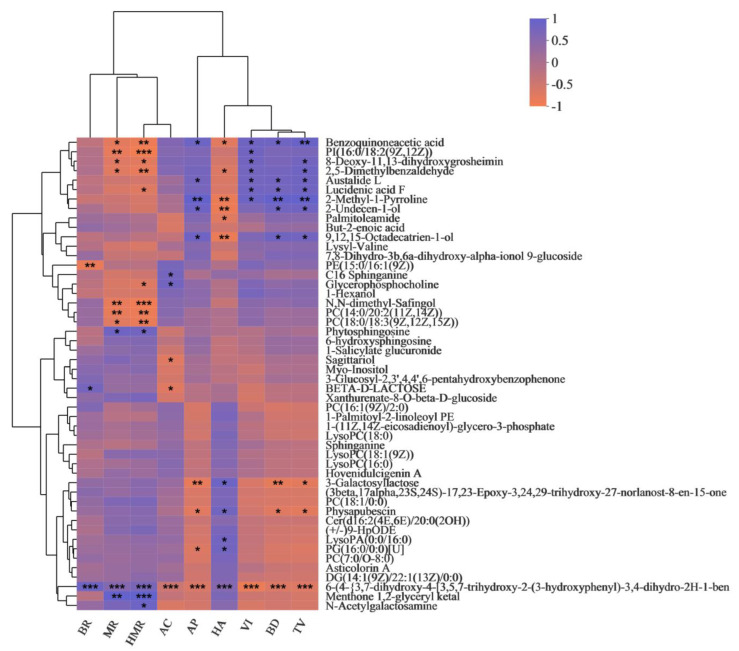
Figure 3.
Correlation analysis of BR, MR, HMR, AC, AP, HA, VI, BD, and TV with DMs. The names of the DMs are on the right side, and the names of BR, MR, HMR, AC, AP, HA, VI, BD, and TV are on the bottom. Each grid represents the correlation between the two attributes, and different colors represent the size of the correlation coefficient between the attributes. * p < 0.05; ** p < 0.01; *** p < 0.001.

