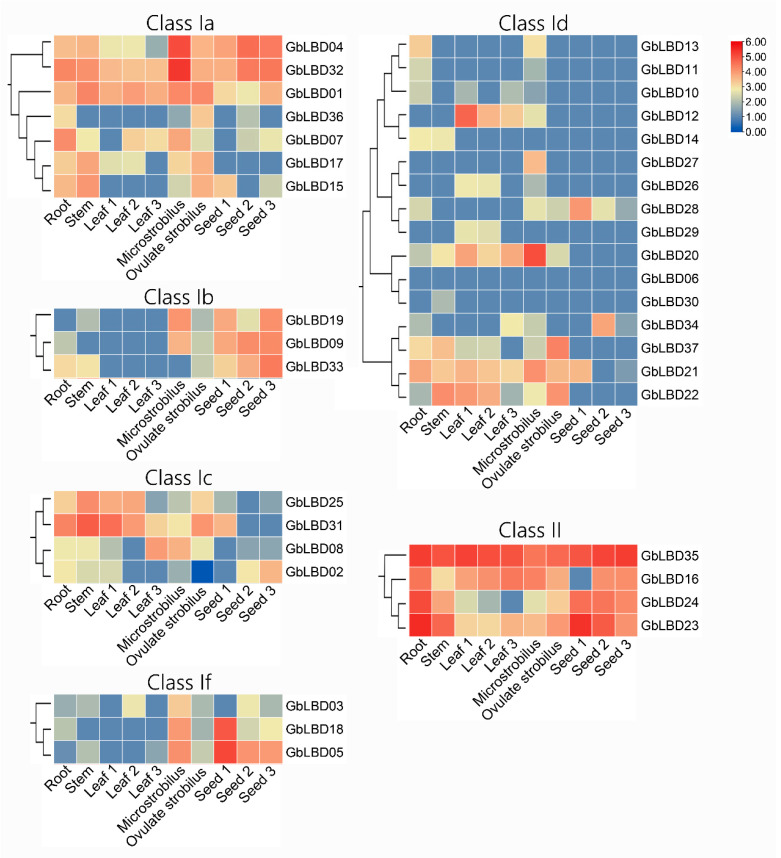
Figure 7.
Heatmap of the expression of 37 GbLBD genes in six different tissues from the root, stem, leaf, microstrobilus, ovulate strobilus, and seed of plants. Red indicates high expression, blue indicates low expression, and the color scale in the upper right corner indicates the TPM value normalized by log10. Note: Leaf1, Leaf2 and Leaf3 represent June, August and October leaves, respectively; seed1, seed2 and seed3 represent June, October and January seeds, respectively. TPM, Transcripts Per Kilobase of exon model per Million mapped reads.

