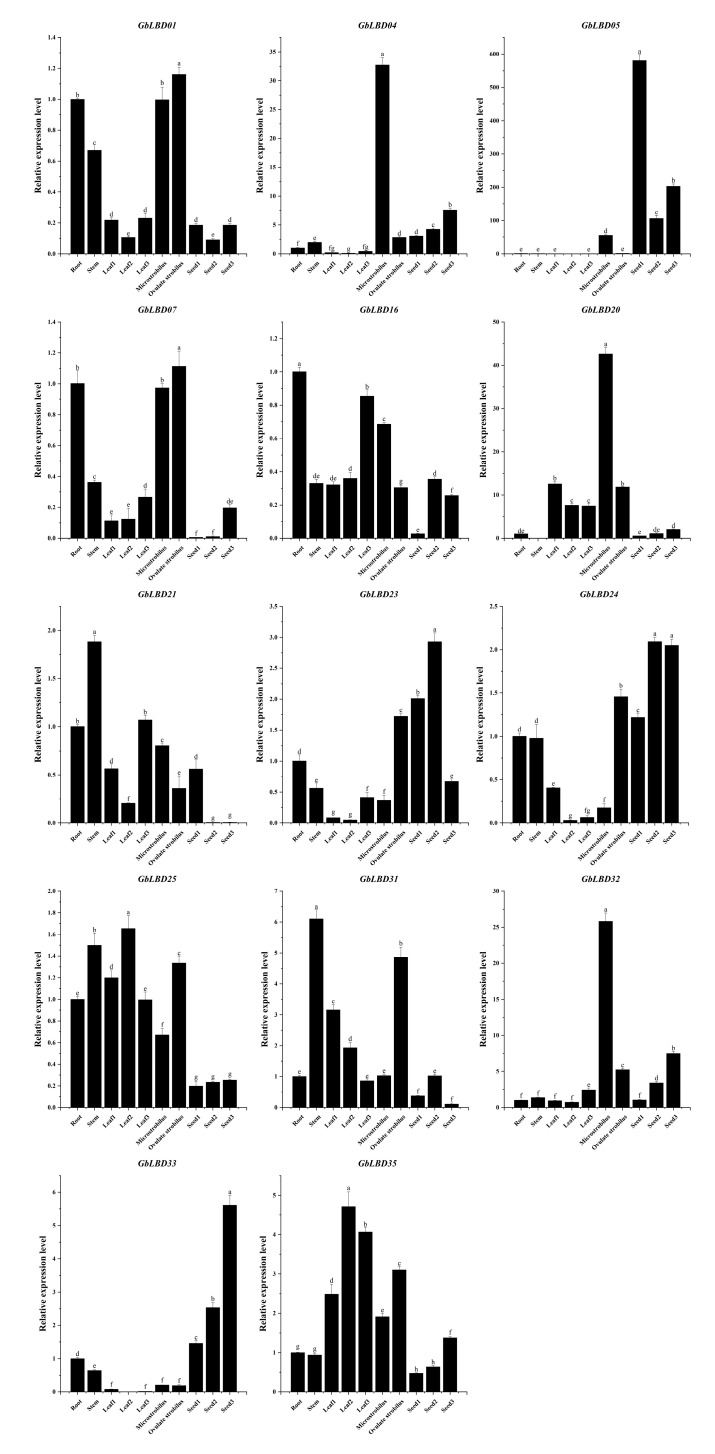
Figure 8.
Expression patterns of fourteen GbLBD genes in different tissues. The x-axes represent different tissues, including roots, stems, leaves, microstrobilus, ovulate strobilus, seeds; the y-axes indicate the relative expression of GbLBD genes. Different letters in a, b, c, d, e, f, g, h indicate significant differences at p < 0.05, as determined by one-way ANOVA with Duncan’s multiple range tests. Note: Leaf1, Leaf2 and Leaf3 represent June, August and October leaves, respectively; seed1, seed2 and seed3 represent June, October and January seeds, respectively.

