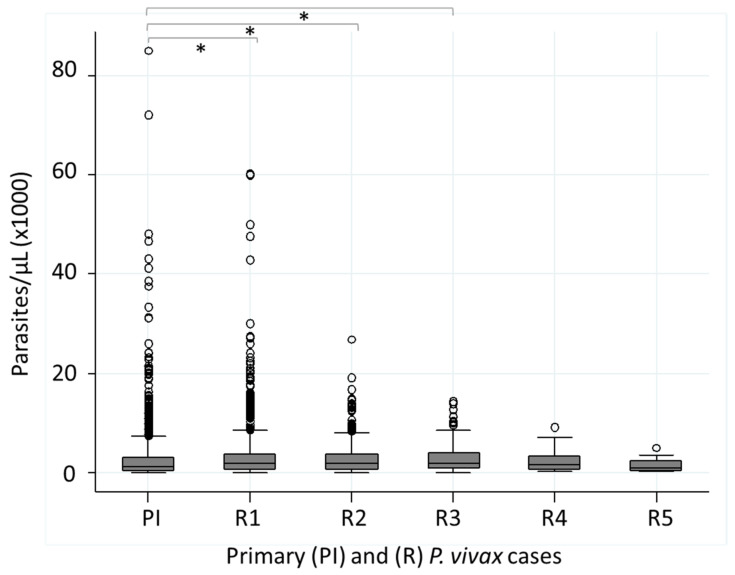
Figure 5.
Distribution of P. vivax parasitemia (parasites/µL) in relation to the primary and recurrent blood infections in patients from Puerto Cabezas, RACCN, Nicaragua. Aggregated data of the primary infection (n = 1986) and recurrent infections, R1 (n = 2123), R2 (n = 545), R3 (n = 132), R4 (n = 37), and R5 (n = 17). Kruskal–Wallis: χ2 (5) = 79.7, p < 0.001. The comparisons with significance at 95% are indicated (*). PI (median = 1200, IQR 360–3120) versus R1 (median = 1740, IQR 660–3870); z = −7.78, p < 0.001. PI vs. R2 (median = 1860, IQR 720–3750; z = −5.95, p < 0.0001), and PI vs. R3 (median = 1875, IQR 885–3990; z = −3.76, p = 0.0002).

