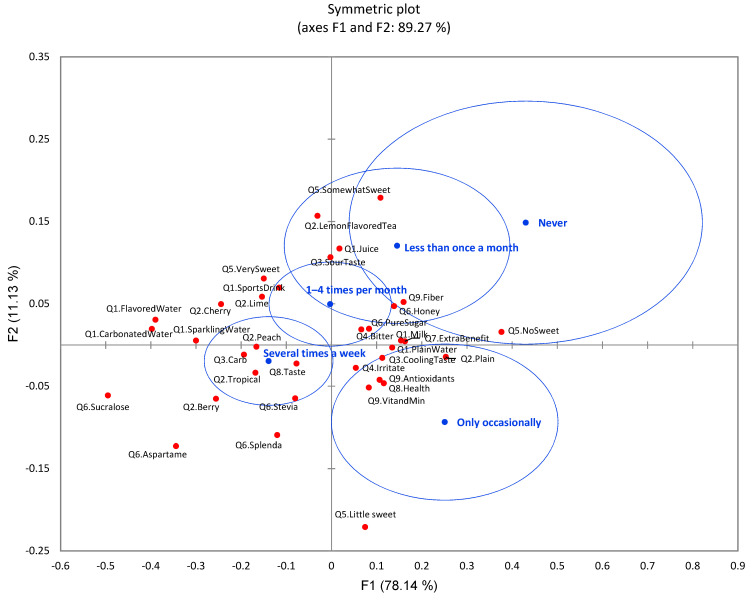
Figure 12.
The first two dimensions of correspondence analysis (CA) symmetric plot using drink frequency (never, only occasionally, less than once a month, 1–4 times per month, and several times a week) as rows and all nine survey questions as columns (n = 901) (5 rows × 37 columns). Confidence ellipses on the plot were automatically created by XLSTAT software based on CA with observed χ2 = 414.84 and p < 0.0001.

